.png)

There’s an endless supply of real estate statistics out there, but what the heck do you actually do with them? The old saying “knowledge is power” couldn’t be more true in real estate. Stats are the fuel that drives the market — they shape buyer behavior, influence seller confidence and help you sound like the pro your clients expect you to be. Think about it: would you trust a surgeon who couldn’t explain the procedure? Probably not. The same goes for agents who can’t explain the market they work in every day.
We’ve dug through the data for you and pulled together the most relevant, up-to-date numbers from credible sources like Altos Research, the National Association of Realtors, Zillow and the U.S. Census Bureau. You’ll find the latest stats on home prices, mortgage rates, inventory and more. These are the kind of insights that help you guide clients with confidence, back up your advice with facts and have smarter conversations about what’s really happening in the housing market.
Why are real estate statistics important for agents?
Before we give you the real estate industry statistics, we want to provide a little more food for thought about what you can do with them. As mentioned, knowledge is powerful, but there are other ways you can use these stats to boost your lead generation and nurturing, marketing and street credibility.
While you’re reading through the stats, think about how you can incorporate them into these ideas:
- Gain knowledge and expertise in a specific area (and how it compares to the US market overall)
- Have a confident answer for “How’s the market?”
- Compete with other agents by highlighting your knowledge
- Understand client behavior and perceptions
- Share statistics with clients to educate and stay on top of mind
- Post on social media and email to engage your target audience
- Add stats to your personal website to build authority and provide value
General statistics
These general statistics will give you an overview of the national US real estate market. While you want to know the stats specific to your area, it is important to know how your location stacks up against the rest of the country. This proves your expertise to clients and allows you to provide them with knowledge about the real estate market.
- The median list price of homes in the US is $427,900; the median price of new listings is $390,970.
- The average days homes stay on the market is 119 days; the median days on market is 77 days.
- There is currently an inventory of 830,445 properties.
- The price per square foot is $210, decreased from $216 in March 2025.
- 41% of properties have seen a decrease in price; 2% of properties have seen a price increase.
- 10% of properties have been relisted.
- The market action index is 34, indicating that there is a slight seller’s advantage.
If you want more statistics like these that are specific to your location, check out Altos–that’s where the stats above are from! Sign up for free to get up-to-date zip code and county numbers. Is there a better way to make yourself the go-to agent in your area? Plus, these reports are weekly, unlike other sites that typically do reports once a month or once a year.
Visit Altos ResearchSources: Altos Research; Research and Statistics, NAR
Homebuyer statistics
Part of being a great buyer’s agent is getting inside the mind of a buyer. You can do just that by reviewing real estate statistics that quantify the behaviors, decisions and trends of the mass buyer population. Also, understanding the behaviors of different demographics will let you get into the psyche of the buyer clients you want to target with your marketing efforts.
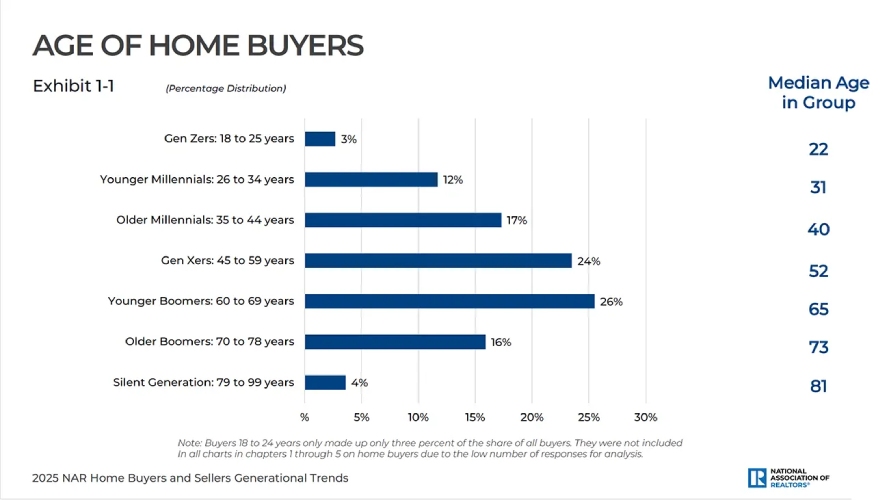
- The largest number of homebuyers are Younger Boomers aged 59 to 68 (26%). This is followed by Gen Xers aged 44 to 58 years old (24%), Older Gen Y/Millennials aged 34 to 43 (17%), Older Boomers aged 69 to 77 (16%) and Gen Y/Millenials aged 25 to 33 (12%).
- 24% of buyers are first-time buyers, and 71% of those first-time homebuyers are aged 25 to 33.
- The primary reason for buyers under the age of 59 to purchase a home is the “desire to own a home.” The primary reason to purchase a home over 60 is to be closer to family.
- 19% of homebuyers between the ages of 44 to 58 own a multi-generational home that houses themselves plus adult siblings or children, parents and/or grandparents.
- Gen Xers purchased the largest homes, along with Younger Millennials at a median of 2,000 square feet.
- 81% of homes bought were three bedrooms or more, and 60% had two full bathrooms.
- The most important environmentally friendly features buyers desired are heating and cooling costs (33%) and commuting costs and energy-efficient appliances (both 31%).
- 30% of buyers compromised on the price of the home, while 23% of buyers compromised on the condition of the home.
- Sellers typically lived in their homes for 10 years before selling. Younger Millennials stayed in their homes for five years, compared to 16 years for Older Boomers.
- Buyers spent 10 weeks searching for a home, two weeks searching before contacting an agent and viewed seven homes during their search.
- Homebuyers found photos to be the most valuable feature found on a listing website (83%).
- 74% of buyers financed their home purchase, and 19% of people financed 80% to 89% of the home.
Sources: Home Buyers and Sellers Generational Trends Report, NAR; Profiles of Home Buyers and Sellers, NAR
Related articles
From consultation to closing: The definitive homebuying checklist
Home Seller statistics
Similar to knowing buyer clients, if you choose to work with sellers, you need to know what makes them tick. Your ultimate goal is to get their house sold, but learning why people want to sell will give you a leg up in connecting with your clients as well as how to get their home sold.
- 91% of sellers used an agent to sell their home.
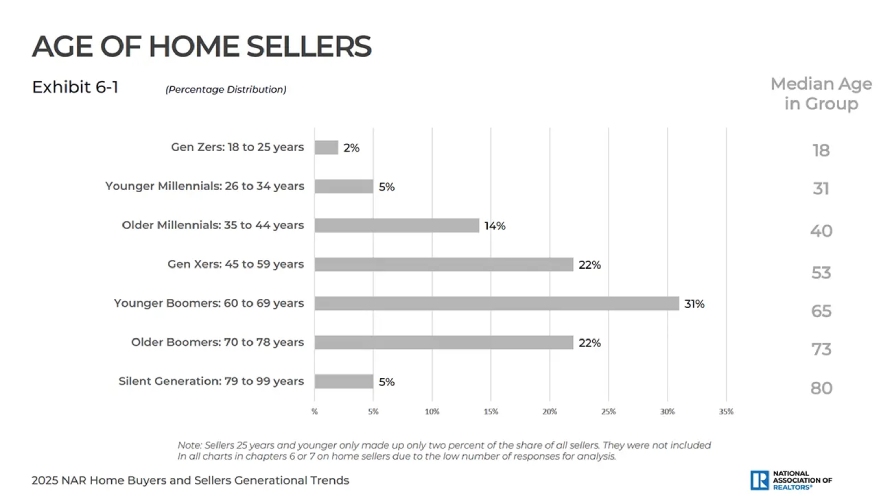
- The largest number of homesellers, 31%, are Younger Boomers aged 59 to 68 years old. This is followed by Gen Xers aged 44 to 58 (22%), Older Boomers aged 69 to 77 (22%), Older Gen Y/Millenials aged 34 to 43 (14%) and Younger Gen Y/Millenials aged 25 to 33 and Silent Generation aged 78 to 98 (both 5%).
- 76% of sellers are repeat sellers, 24% are first-time sellers.
- Most sellers sold a larger home to purchase a smaller home, with a difference of -200 square feet.
- The primary reason for selling a home was to move closer to friends or family (23%), the home was too small (12%) or the home being too large (11%).
- 26% of sellers spent 21 years or more in their home before selling.
- 64% of people did not reduce their asking price; 21% reduced the price one time.
- 43% of sellers were not urgently selling their home and waited for the right offer, 42% were somewhat urgent and had to sell their home in a reasonable time frame and 15% needed to sell their home as quickly as possible.
Sources: Home Buyers and Sellers Generational Trends Report, NAR; Profiles of Home Buyers and Sellers, NAR
Rental market statistics
I worked in the fast-paced New York City rental market for years, and there are a lot of clients and a lot of money to be made. Plus, rental clients move quite often or are one step away from buying, which means more transactions and exposure to different transactions. These rental real estate statistics will help you understand the market and hone your expertise.
- As of October 2025, the national median rent price is $1,381.
- Quarter four of 2025 cites a rental vacancy rate of 7.2%.
- Rent prices are down 0.9% compared to one year ago.
- 243 thousand multifamily units were completed in the first half of 2025 – that’s down 27% from the second half of 2024.
- Rental units are staying on the market for a median of 33 days.
- 35% of the US are renters; homeownership rates are 65%.
- The median age of renters is 41 years old, and 65% of renters are aged 40 or younger.
- Gen Zers have the highest number of renters (44%), followed by Millennials (32%), Gen Xers (14%), Baby Boomers (9%) and Silent Generation members (1%).
- 46% of renters earn less than $50,000 a year, 31% earn between $50,000 to $100,000 and 22% earn more than $100,000.
- 59% of renter households have a pet of some kind; 40% have a dog and 30% have a cat.
- The highest numbers of renters live in the South (42%), then the West (25%), Midwest (21%) and Northeast (12%).
- 59% of renters said the most important item of picking a rental home was seeing the lease terms, rent amount and fees. Other important items were taking a private tour (55%), meeting/speaking with the property manager or landlord (47%) and seeing reviews of the property manager or landlord (37%).
- When choosing a rental property location, renters found their commute to be the top feature (57%), followed by a walkable neighborhood (55%) and proximity to shopping, services and/or leisure activities (53%).
- 64% of renters thought about buying during their rental search.
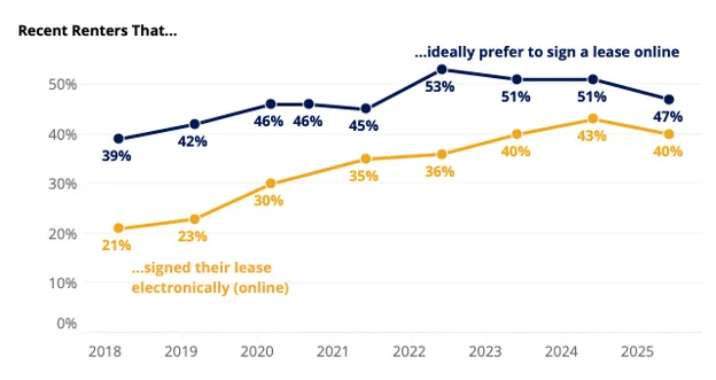
- 47% of renters would prefer to sign their leases electronically, but only 40% actually signed electronic leases.
Sources: Zillow, Doorloop, Apartment List
Housing affordability statistics
Housing affordability has become one of the biggest pressure points in today’s housing market. These mortgage loan statistics break down what different income levels can realistically afford in today’s market and how far the current supply goes in meeting buyer demand. Agents can use these to help clients understand what’s realistically within reach and where there are growing gaps and concerns in 2026.

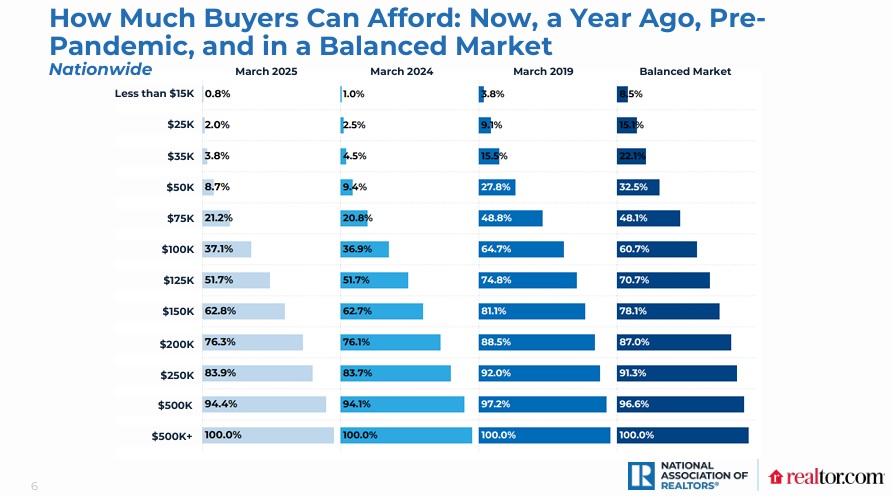
- Households earning $50,000 per year can only afford 8.7% of active listings which is down from 9.4% a year ago. Those earning $75,000 a year can afford 21.2%, while households earning $100,000 a year can afford 37.1% of listings.
- Even with recent inventory increases, middle-income buyers still have access to less than half of the market compared with 2019.
- The U.S. needs roughly 416,000 more listings priced at or below the threshold for middle-income buyers to reach a balanced market.
- Households earning $200,000+ have access to 80 to 100% of active listings nationwide which highlights the growing affordability gap for lower and middle-income buyers.
Sources: Housing Affordability and Supply, NAR
Mortgage loan statistics
Mortgage lending trends continue to shift. Today’s buyers are relying on a wide range of financing strategies to make their home purchases possible. From all-cash deals hitting new highs to down payments climbing to levels we haven’t seen in decades, the way buyers fund their homes says a lot about the state of the market. Here’s a look at the mortgage loan statistics and what they mean for both first-time and repeat buyers.
- 26% of home purchases have been all-cash over the last year, reaching an all-time high. Between 2003 and 2010, fewer than one in 10 buyers paid all cash on a home sale.
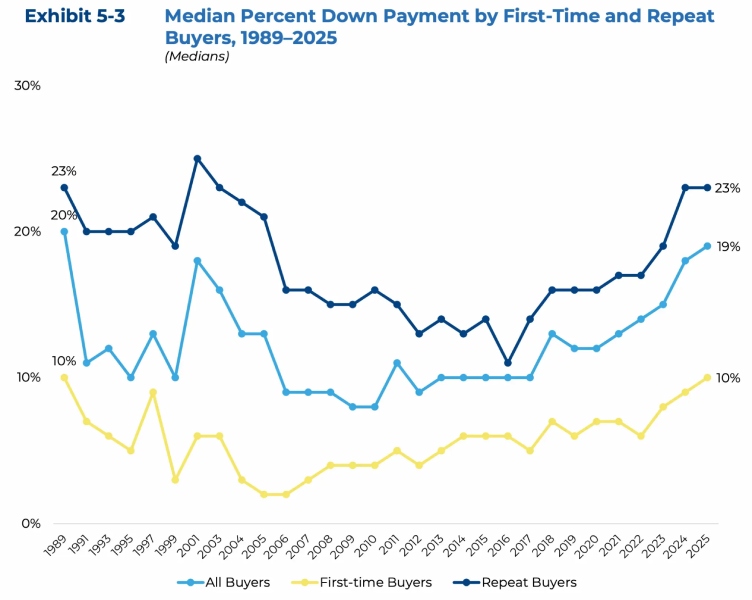
- So far in 2025, the median down payment among all buyers was 10% to 19% for first-time buyers and 23% for repeat buyers.
- The median down payment for first-time homebuyers is the highest it’s been since 1989, and the highest for repeat buyers since 2003.
- Personal savings are the most common source for down payments among first-time buyers (59%), while 26% tapped into financial assets such as 401Ks, IRAs or stocks and 22% received help from relatives or friends through a gift or loan.
- 54% of repeat buyers used proceeds from the sale of a previous home to finance their next purchase.
Sources: Profile of home buyers and sellers, NAR
Commercial real estate statistics
Diving into commercial real estate statistics is a bear because the commercial market is divided into a bunch of different sectors. Most times, commercial agents focus on one or two sectors as their niche so they can become an expert working with a specific type of client. I added several statistics by sector below to give you an idea of how each market is doing.
- In the office sector, vacancy edged down to 14.0% for the first time in six years while rent growth eased to 0.7% as landlords continue to rely on incentives to attract and retain tenants.
- The multifamily sector continues to balance itself with net absorption at just over 506,000 units as construction activity has slowed.
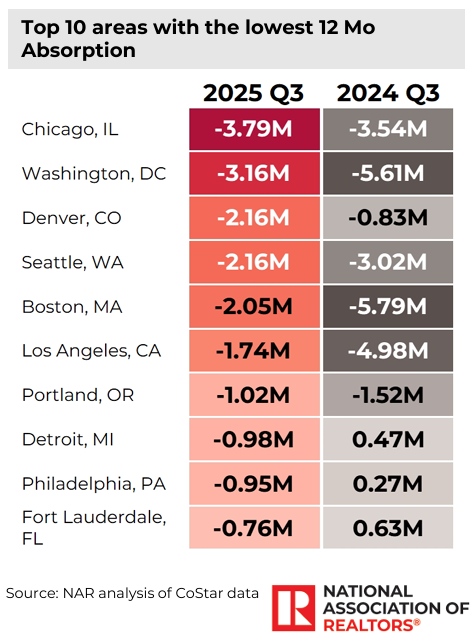
- In the retail sector, the absorption rate has fallen to – 4.3 million square feet over the past year ending in September and rent growth easing to 1.9%.
- The industrial sector has seen a continued loss of momentum as new construction outpaced tenant demand. Vacancy inched higher and rent growth eased, reflecting a market still digesting several years of rapid expansion.
- At 62.7% occupancy, the hotel/hospitality sector remains below pre-pandemic levels by 3%.
- The delinquency rate of CRE loans at the end of Q2 2025 was 1.57% totalling 3.03 trillion in lending in August of 2025.
Sources: Commercial Real Estate Market Insights Report, NAR
Real estate agent statistics
While these real estate statistics encompass information about buyers and sellers, they center on how the agent is directly impacted. These stats show the effect that agents have on the real estate buying and selling process and the importance that they play at all stages of a transaction. Take these into account when strategizing your lead generation and how you work with clients.
- 88% of homebuyers found their home with a real estate agent or broker.
- 50% of home buyers sought help with finding the right home to purchase followed by negotiating the terms of the sale (13%), price negotiations (12%) and help with paperwork (7%).
- The top benefits agents provided to homebuyers was helping understand the process (52%), pointing out unnoticed features/faults with property (54%) and negotiating better sales contract terms (45%) and providing a better list of service providers (44%).
- 40% of buyers and 38% of sellers found their agent through a friend, neighbor or relative.
- Referrals by friends, neighbors or relatives were higher among Younger Millennial buyers (54%) and Older Millennial Buyers (42%) compared to older generations.
- Older buyers were more likely to work with an agent they had previously used to buy or sell a home.
- The most important factors when choosing a buyer’s agent are the agent’s experience (23%), honesty and trustworthiness (19%) and the agent’s reputation (15%).
- The most important factors for seller’s agents were the reputation of the agent (35%), honesty and trustworthiness (21%) and the agent being a friend or family member (16%).
- 71% of buyers thought personal calls to inform them of activities was the most important agent communication strategy; 71% found text messages with property info and communication were most important.
- 81% of sellers contacted only one agent to assist with the sale of their home.
- 50% of sellers used the same agent to sell their home and purchase a new one.
- Sellers were most interested (22%) in an agent who could help the sellers market the home to potential buyers (22%). They also wanted an agent who could help price their home competitively (20%) and help within a specific timeframe (18%).
- 75% of seller’s agents were paid by the seller; 52% of buyer’s agents were paid by the seller.
Sources: Home Buyers and Sellers Generational Trends Report, NAR; Profiles of Home Buyers and Sellers, NAR
Related article

How to be a successful real estate agent in 9 steps
The full picture: Real estate statistics
These real estate industry statistics give you a powerful advantage over agents who are just here for a quick buck. Incorporating these into your conversations will instill confidence in yourself but will also give your clients confidence in you and your abilities to help them buy, sell or rent a property. So, save this article, memorize these stats and share them wherever you can. They’re tools you can use every single day.
------------Read More
By: Gina Baker, Emile L'Eplattenier
Title: 70 real estate statistics to watch for 2026 market trends
Sourced From: www.housingwire.com/articles/real-estate-statistics/
Published Date: Fri, 05 Dec 2025 18:52:10 +0000


Dwell’s First Issue Featured This Ship-Like Bay Area Home Seeking $899K

Apple launches Klarna device leasing in US from $17.99 a month

The Download: computing’s bright young minds, and cleaning up satellite streaks

One of Frank Gehry’s Early L.A. Homes Just Hit the Market for $1.7M