.png)
Now that jobs week is over, we are all left with one truth: it really is about the labor market over inflation data when it comes to mortgage rates, which hit a fresh year-to-date low after Friday’s terrible jobs numbers.
The question now is whether mortgage rates can drop below 6% and stay there with some duration in 2025 or 2026. That has seemed impossible to do since late 2022. With Fed policy still modestly restrictive, we have only approached 6% when the bond market thinks the economy is performing poorly. This is the question I’ll address today.
10-year yield and mortgage rates
In my 2025 forecast, I anticipated the following ranges:
- Mortgage rates between 5.75% and 7.25%
- The 10-year yield fluctuating between 3.80% and 4.70%
Overall, 2025 is on track with my forecast. The 10-year yield has remained within its proper range in response to Federal Reserve policy and economic conditions, while mortgage rates have fluctuated between 6.29% and 7.25%. However, even with job growth slowing —evidenced by a recent report showing negative job creation in one report — we still haven’t dipped below 6% in mortgage rates. I talked about this in detail during today’s special episode of the HousingWire Daily podcast.
But the simple answer here is Fed policy is still too restrictive to get mortgage rates to really go lower than 6% and stay there. In the past two years, the 10-year yield has reached levels of 3.37% and 3.63%. At those levels, we could see mortgage rates drop below 6% today, especially given the favorable spreads currently available. However, during both of those periods, the bond market was anticipating a recession.
The point here is we have been here before with mortgage rates near 6%, but to go lower, we would need a weaker economy or the Fed crying uncle and turning dovish.
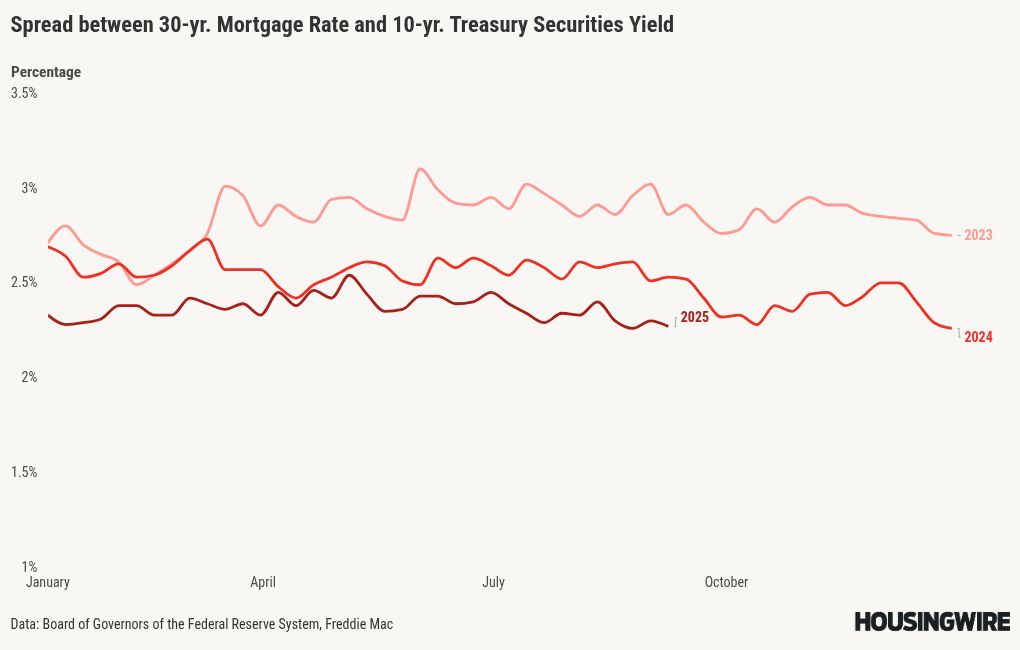
Mortgage spreads
This year has seen favorable pricing primarily due to improvements in mortgage spreads compared to the levels of 2023 and 2024. As long as there are no significant market disruptions and the Federal Reserve continues to cut rates toward neutral, this trend is expected to continue.
If the spreads today were as bad as they were at the peak of 2023, mortgage rates would currently be 0.83% higher. Conversely, if the spreads returned to their normal range, mortgage rates would be 0.47% to 0.67% lower than today’s level. Historically, mortgage spreads have ranged between 1.60% and 1.80%.
The best levels of normal spreads would mean mortgage rates at 5.82% % to 6.02% today.
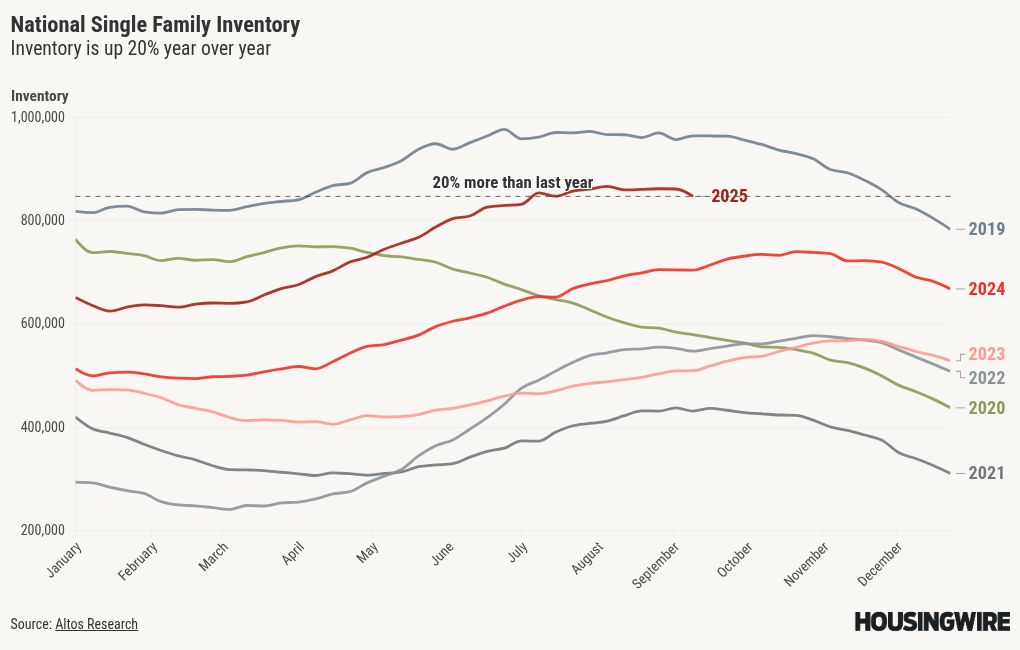
Weekly housing inventory data
I typically adjust our weekly data to account for national holidays because many people take vacations or engage in leisure activities instead of searching for homes or listing their properties. With Labor Day last week, we observed a noticeable decline in our weekly inventory data. I anticipate a rebound in active listings this week — if that doesn’t happen, I’ll address it. Our Housing Market Tracker data has shown a shift in the national markets since mid-June and I still want to respect this trend.
For example, it’s been rare for active inventory to decrease in August over the past few years, but it did this year. Therefore, we should pay attention to this trend given its duration. The year-over-year inventory growth rate recently peaked at 33%, but it has since dropped to 20% and is now in jeopardy of being cut in half as mortgage rates are nearing 6%.
Last week, inventory fell.
- Weekly inventory change (Aug. 29-Sept. 5): Inventory fell from 860,728 to 846,516
- The same week last year (Aug. 30-Sept 6): Inventory fell from 704,654 to 703,376
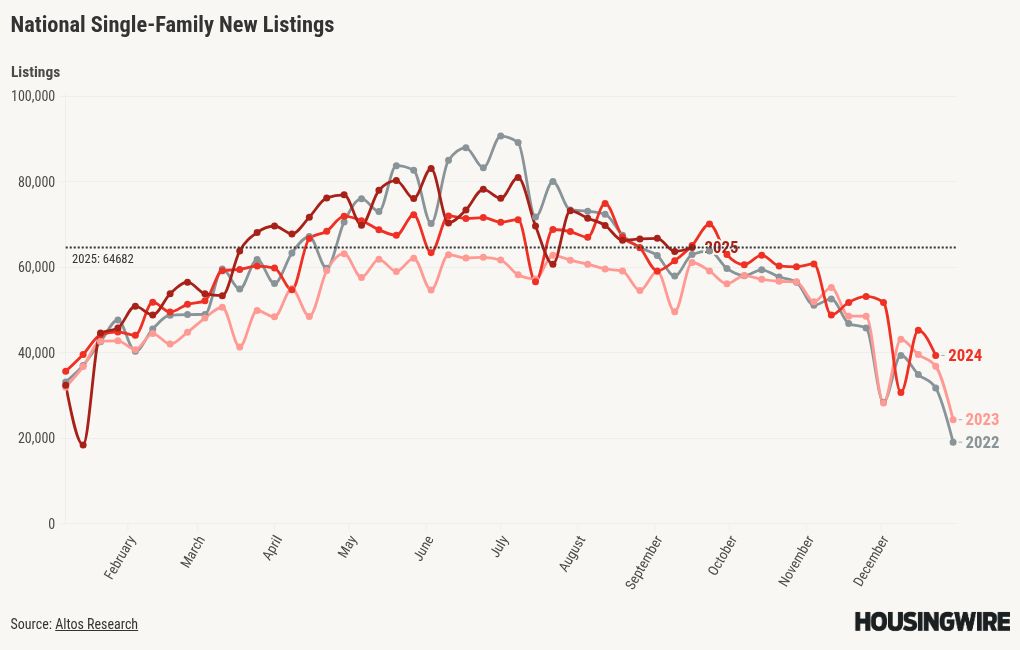
New listings data
The new listings data peaked during the week of May 23 this year, reaching a total of 83,143 listings. Since then, this number has gradually declined. Initially, I was excited about reaching my target of 80,000 weekly listings for 2025, which we didn’t reach at all last year. But we didn’t see the growth above 80,000 that I was looking for and now we are in our traditional seasonal decline period.
To give you some perspective, during the years of the housing bubble crash, new listings were soaring between 250,000 and 400,000 per week for many years. Here’s last week’s new listings data over the past two years:
- 2025: 64,682
- 2024: 61,936
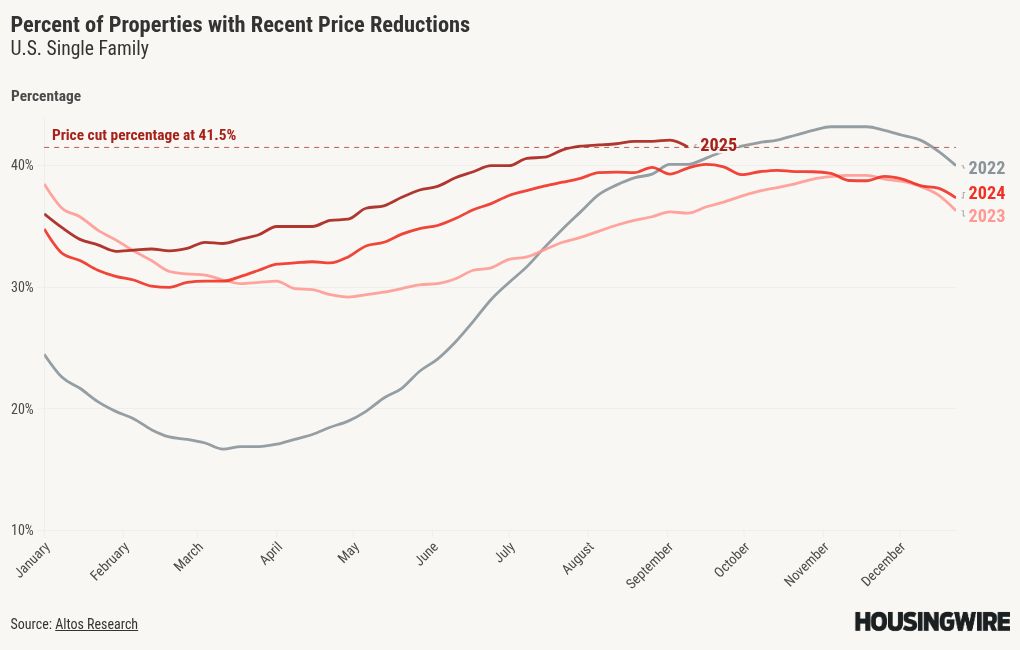
Price-cut percentage
In an average year, approximately one-third of homes experience price reductions. Homeowners often lower their sale prices when inventory levels increase and mortgage rates remain high, which is why the percentage of price reductions is greater in 2025 than it was last year. This has been another great story for housing in 2025, as the housing market has become a much more friendly market for buyers in 2025.
For my 2025 price forecast, I anticipated a modest increase in home prices of approximately 1.77%. This suggests that 2025 will likely see negative real-home prices again. In 2024, my forecast of a 2.33% increase proved inaccurate, primarily because rates fell to around 6% and demand improved in the second half of the year. As a result, home prices increased by 4% in 2024. The rise in price reductions this year compared to last year reinforces my cautious growth forecast for 2025. This data line growth rate has also cooled down recently.
We saw a notable decline week to week in the price-cut percentage, but I will wait to see if this is a trend next week, as the holiday might have distorted this data line
Here are the percentages of homes that saw price reductions last week in the past few years:
- 2025: 41.5%
- 2024: 39%
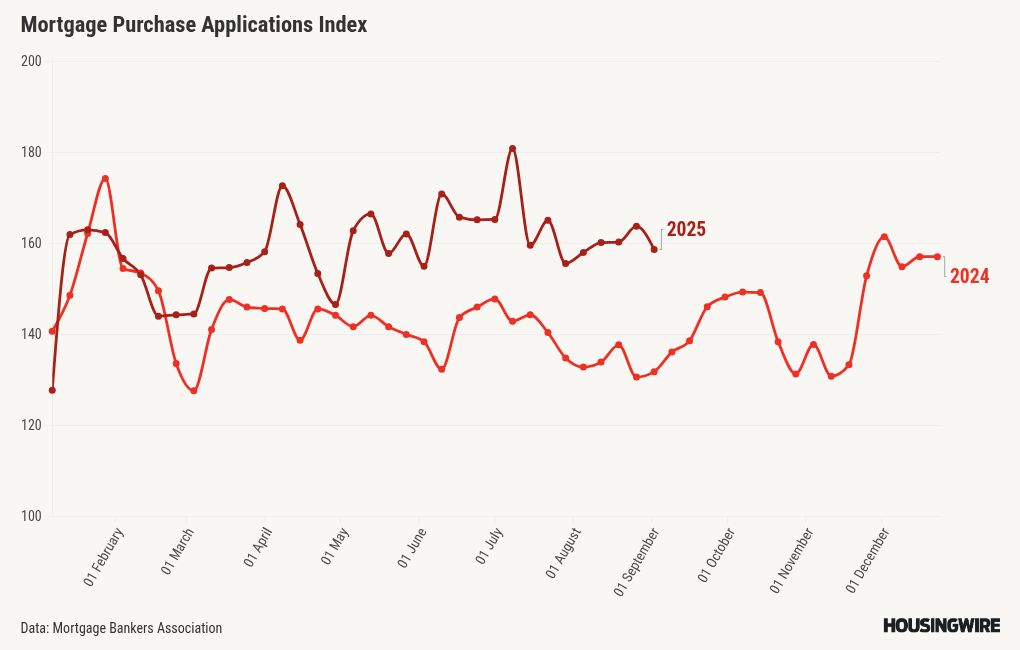
Purchase application data
We’ve had five weeks of testing the housing data with rates under 6.64%, which has been the key level in the past. So far, the trend is positive, which has been the norm since 2022. This week, we saw a -3% decline in the week-to-week data, but it was up 17% year over year. This makes four positive weeks and one negative on a week-to-week basis.
Here is the weekly data for 2025 so far:
- 16 positive readings
- 12 negative readings
- 6 flat prints
- 31 straight weeks of positive year-over-year data
- 18 consecutive weeks of double-digit growth year over year
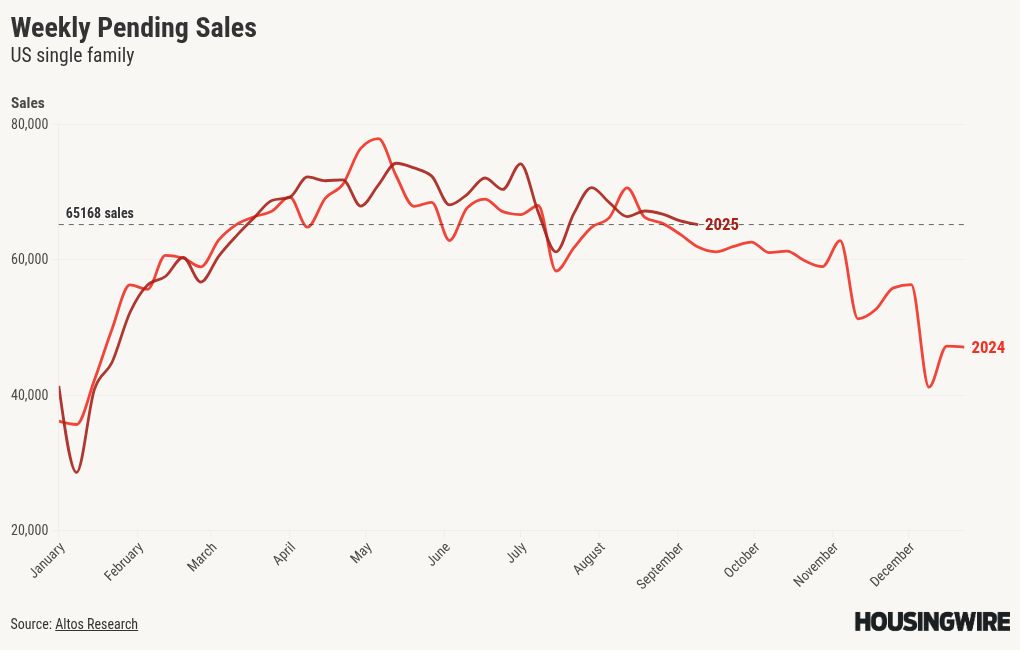
Weekly pending sales
Our weekly pending home sales provide a week-to-week glimpse into the data; however, this data line can be impacted by holidays and any short-term shocks. We are still showing slight year-over-year growth in this data line. The pending sales data will typically hit the existing home sales report 30-60 days out.
Weekly pending sales for last week:
- 2025: 65,168
- 2024: 62,181
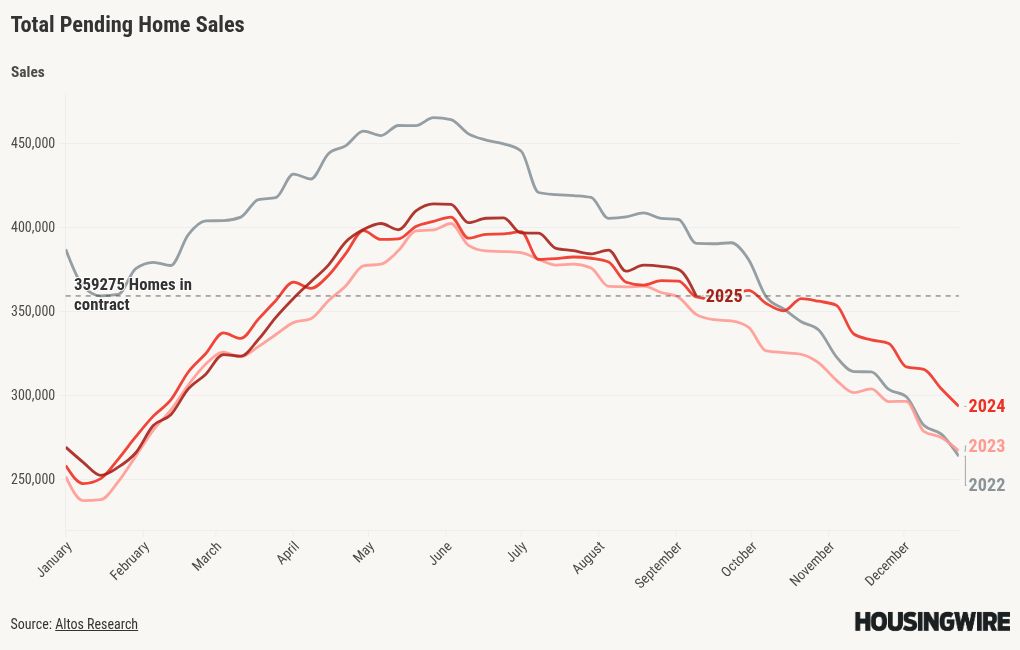
Total pending sales
The latest total pending sales data from HousingWire Data provides valuable insights into current trends in housing demand. Last year, we observed a significant shift when mortgage rates decreased from 6.64% to around 6%. We have achieved consistent low-level year-over-year growth recently and this week continues that trend, It will be interesting to see this data line over the next few months if rates can stay at the low 6% level.
Total pending sales last week over the last two years:
- 2025: 359,275
- 2024: 357,687
The week ahead: Inflation week and jobs revisions
After jobs week, we run right into inflation week, which is still very important to the Federal Reserve, as they have been very cautious about rate cuts due to tariff inflation. We also have the annual job revisions coming up, which can move the markets as well. Jobless claims data will be released on Thursday; it had a slight pick-up last week.
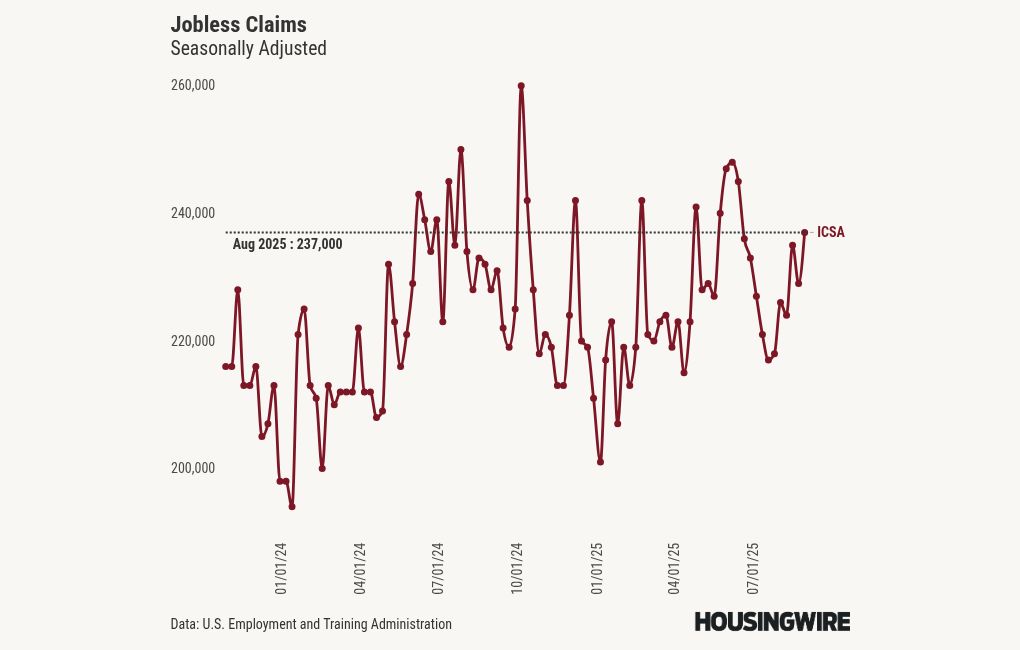
Be prepared for some more economic data drama this week, as this will be the last week of data before the Fed meets.
------------Read More
By: Sarah Wheeler
Title: Can mortgage rates get below 6% with this Federal Reserve?
Sourced From: www.housingwire.com/articles/can-mortgage-rates-get-below-6-with-this-federal-reserve/
Published Date: Sun, 07 Sep 2025 01:53:54 +0000