.png)
Last week, housing inventory levels decreased noticeably, while our weekly pending sales showed a notable increase compared to the same period last year. Was the decrease in inventory primarily due to the seasonal decline in housing stock, or did the increase in demand contribute to lowering the inventory unmbers? Let’s dive into this weekend’s tracker to find out.
Weekly housing inventory data
Housing inventory growth during the prime selling season was up 33% year over year, and recently it has moved lower toward 16%. As demand picked up slightly, and new listings data began to decline, the growth rate of inventory has slowed by half, but remains up year over year in a healthy manner. The year-over-year growth has provided a much more buyer-friendly marketplace, but we are entering the seasonal decline in inventory for 2025.
- Weekly inventory change (Oct. 31-Nov. 7 ): Inventory fell from 856,701 to 842,242
- The same week last year (Nov. 1-Nov. 8): Inventory fell from 735,663 to 721,576
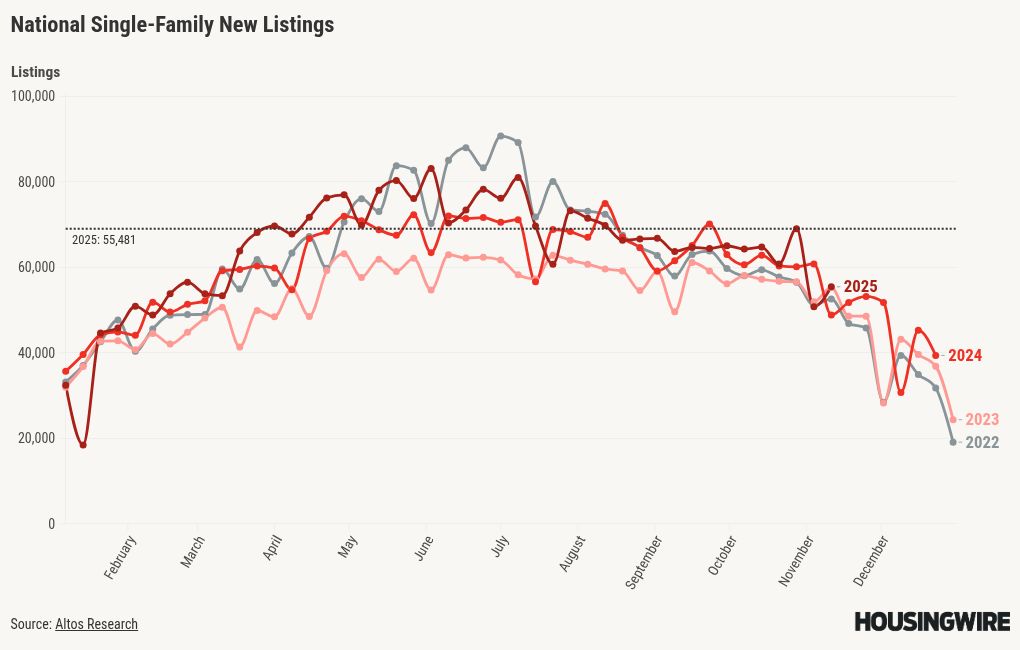
New listings data
Over the past three weeks, our Housing Market Tracker has shown some fluctuating data, but things seem to be returning to normal. Last week, we saw some growth in new listings even as we enter a seasonal decline period. Once again, in 2025, the new listings data is not exhibiting any signs of seller stress.
To give you some perspective, during the years of the housing bubble crash, new listings were soaring between 250,000 and 400,000 per week for many years. Here’s last week’s new listings data over the past two years:
- 2025: 55,481
- 2024: 48,863
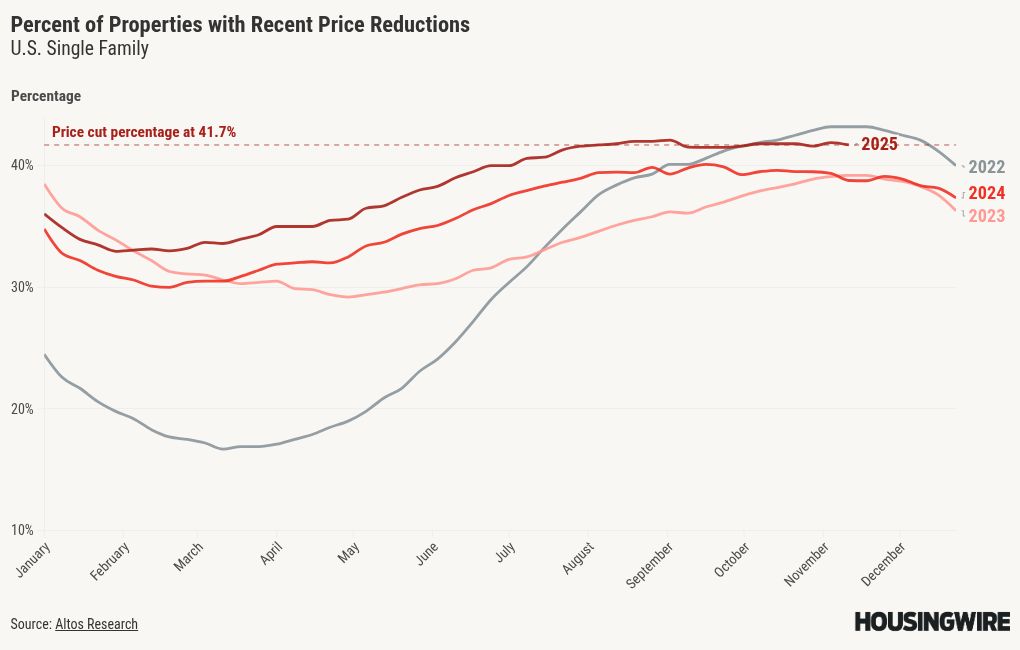
Price-cut percentage
In a typical year, approximately one-third of homes experience price reductions, highlighting the dynamic nature of the housing market. Homeowners adjust their sale prices as inventory levels rise and mortgage rates stay elevated. With more inventory and higher rates, our price-cut percentage data is higher than last year.
For my 2025 price forecast, I anticipated a modest increase in home prices of approximately 1.77%. This suggests that 2025 will likely see negative real home prices again. The rise in price reductions this year compared to last year reinforces my cautious growth forecast for 2025.
Here are the percentages of homes that saw price reductions in the previous week in the last two years:
- 2025: 41.7%
- 2024: 40%
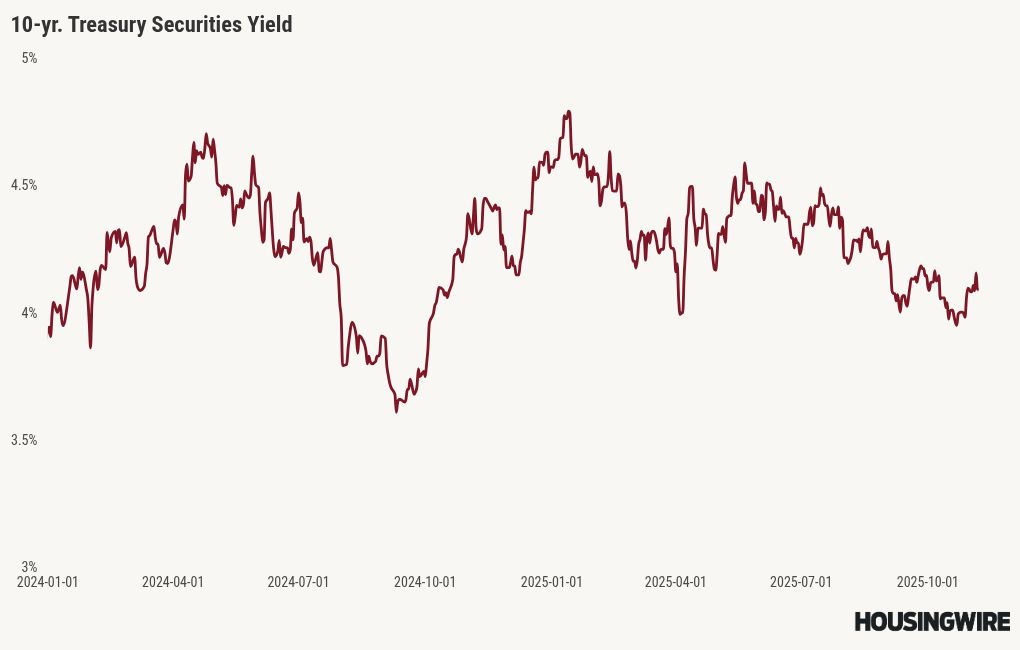
Mortgage rates and the 10-year yield
In my 2025 forecast, I anticipated the following ranges:
- Mortgage rates between 5.75% and 7.25%
- The 10-year yield fluctuating between 3.80% and 4.70%
It was an eventful week for the bond market. Although it was supposed to be jobs week, the usual data we rely on was not available due to the government shutdown. However, the positive ADP report and ISM new orders caused bond yields to rise. The following day, we received labor data that was softer than expected, resulting in a decline in yields.
Overall, the 10-year yield is currently near its yearly lows. This trend is not a result of cooling inflation, but rather a reflection of a weakening labor market, particularly in 2025. The 10-year yield ended up closing roughly where it started the week at 4.10% and mortgage rates ended the week just a tad lower at 6.32%, according to Mortgage News Daily, with Polly rate lock data closing at 6.31%.
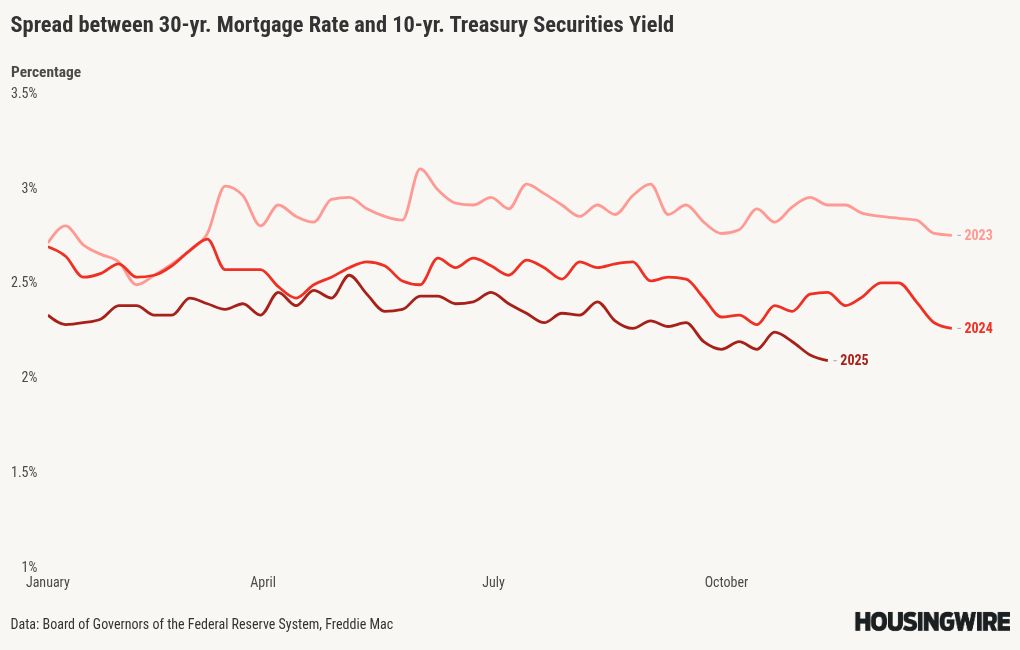
Mortgage spreads
Mortgage spreads have been the best story for mortgage rates in 2025. We are only 0.29% basis points away from normal levels again. The main thing to remember is that mortgage rates would not get near 6% if the spreads didn’t improve this year, and we still have some room for improvement next year.
Historically, mortgage spreads have ranged between 1.60% and 1.80%. If the spreads today were as bad as they were at the peak of 2023, mortgage rates would currently be 1.01 percentage points higher. Conversely, if the spreads returned to their normal range, mortgage rates would be 0.59% to 0.39% lower than today’s level. With normal spreads, mortgage rates would be at 5.83% to 6.03% today.
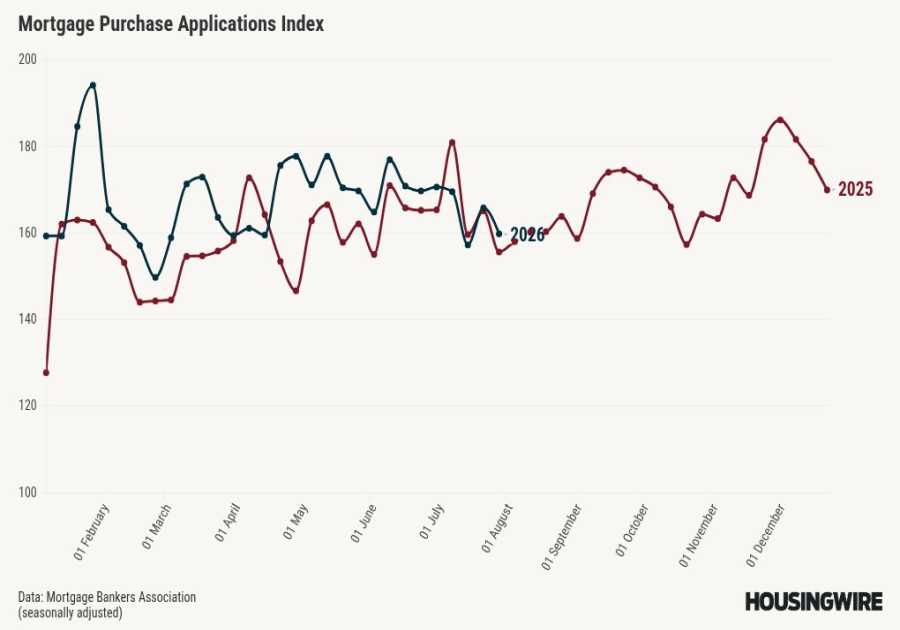
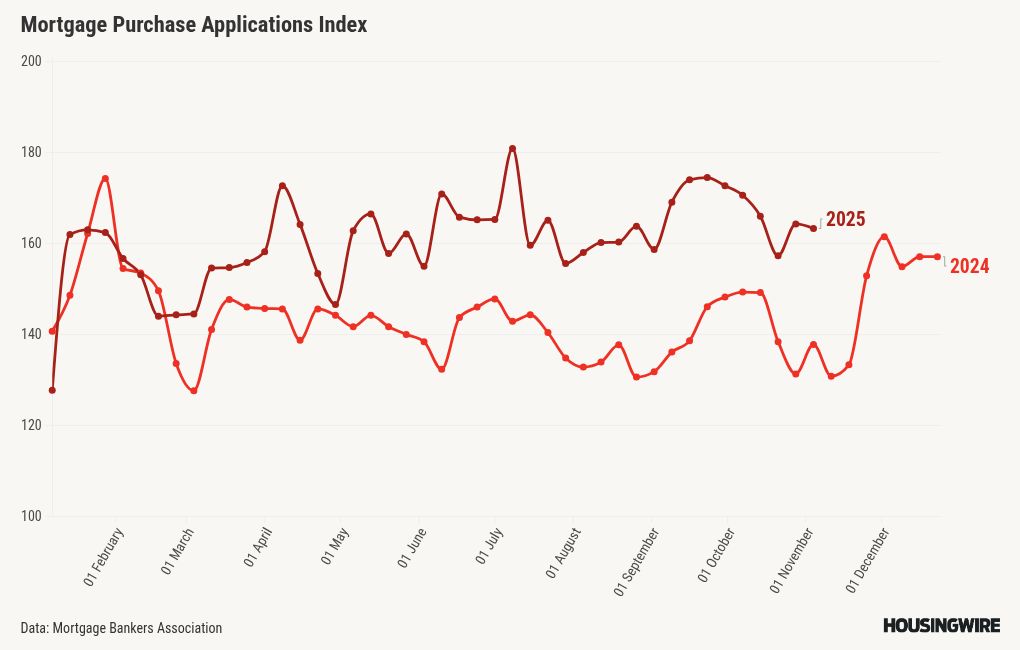
Purchase application data
We’ve had 14 weeks of testing the housing data in 2025 with mortgage rates under 6.64%. In the last few years, housing data has performed better when mortgage rates have fallen below 6.64% and headed toward 6%.
Over the last 14 weeks, we have had eight positive prints, six negative prints and 14 consecutive weeks of double-digit year-over-year growth in purchase apps. Last week saw a 1% decline from the previous week but a 26% increase year-over-year.
Earlier in the year, we saw healthy year-over-year growth, but the weekly data was choppy. The last 14 weeks have been the best of the year, but I would like to see 4 to 6 more weeks of positive week-to-week data. Usually, when rates increase, it does impact the weekly data for next week.
Here is the weekly data for 2025 so far:
- 20 positive readings
- 17 negative readings
- 6 flat prints
- 40 straight weeks of positive year-over-year data
- 27 consecutive weeks of double-digit growth year over year
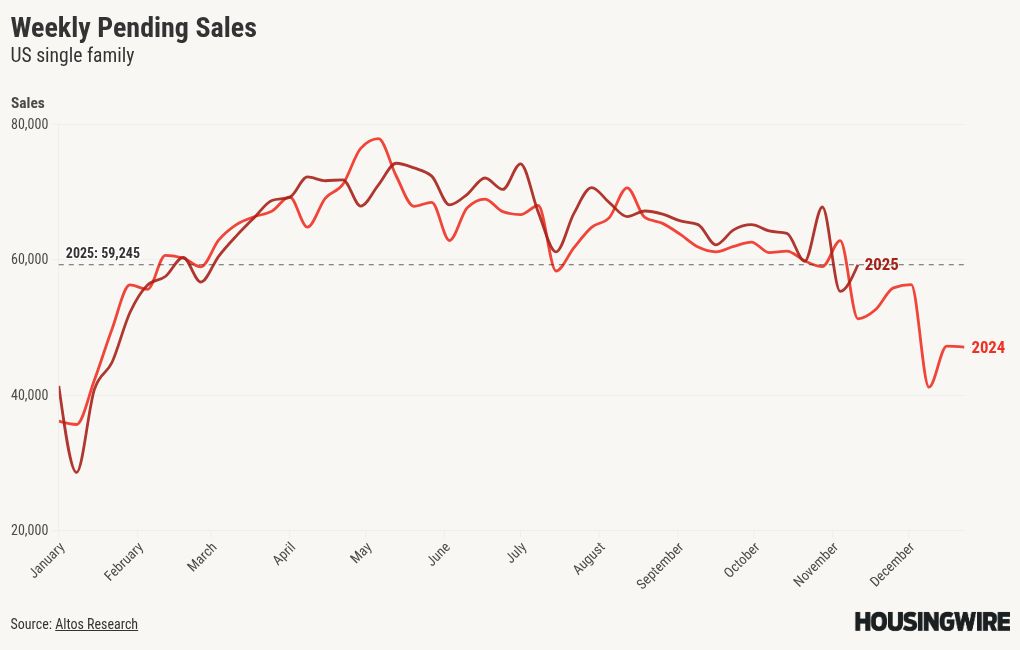
Weekly pending sales
Our weekly pending home sales have been quite volatile, mainly due to the impact of a two-week holiday and the recent AWS outage that affected one of our reporting weeks. However, it appears that things are returning to normal, and we’ve observed a nice week-to-week increase.
On a year-over-year basis, we are showing significant growth. Remember that last year at this time, mortgage rates surged toward 7%, so take that into account when comparing year-over-year data. Nonetheless, mortgage rates near 6% can have a positive impact on the housing market.
Weekly pending sales for last week:
- 2025: 59,245
- 2024: 51,277
The week ahead: No inflation week yet
Typically, I would refer to this as inflation week, but until the government shutdown is resolved, the focus will be on some significant bond auctions that could introduce volatility. Additionally, a few speeches by Federal Reserve presidents may also impact the market. We would normally see retail sales data, but that is unavailable during the shutdown as well. Still, there are still enough events this week to influence rates.
------------Read More
By: Logan Mohtashami
Title: Housing inventory falls as demand picks up
Sourced From: www.housingwire.com/articles/housing-inventory/
Published Date: Sun, 09 Nov 2025 23:14:27 +0000
Did you miss our previous article...
https://trendinginbusiness.business/real-estate/cleaning-for-the-rich-is-now-a-sixfigure-joband-everything-else-you-need-to-know-about-this-week