.png)
The national median list price declined last week.
The median price of newly listed homes increased.
Both are true.
One market, two pricing signals
The overall active median reflects every home currently listed for sale, regardless of when it entered the market or how many price adjustments it has undergone. The new listing median shows how sellers entering the market today are pricing their homes.
When those two measures move in the same direction, they tell a consistent pricing story. When they diverge, the overall median blends homes already on the market with homes entering the market today. Looking at each measure separately reveals pricing signals the blended median can hide.
Housing demand continues to outperform expectations despite elevated mortgage rates. As HousingWire Lead Analyst Logan Mohtashami reported in this week’s Housing Market Tracker, weekly pending sales, total pending sales and mortgage purchase applications all remained positive year over year, although growth has slowed as mortgage rates have remained above his key 6.64% threshold.
HousingWire Data shows that local markets are responding differently.
For the week ending July 31, the national overall active median for single-family homes stood at $449,000, barely down year over year, slipping just 0.4% from $451,000. The median price of homes newly listed that week was $419,900, up 1.2% from $415,000 a year ago.
HousingWire Data found the pattern in 71 of the 298 metro areas analyzed, or nearly one in four U.S. metros. It appeared across every major region.
The national breakdown
Across the 298 metros analyzed, four pricing patterns emerged. Another 24 markets remained essentially flat.
Among the metros analyzed, 85 recorded year-over-year increases in both measures, while 77 recorded declines in both. In 41 metros, the overall active median increased while the new listing median declined. Another 24 markets were classified as flat.
The 71 metros at the center of this analysis show the opposite relationship. Their overall active medians declined while new listing prices increased, indicating that homes entering the market today are being priced differently from the broader inventory already competing for buyers.
Nashville, Buffalo and Milwaukee each illustrate a different version of the same national pricing pattern.
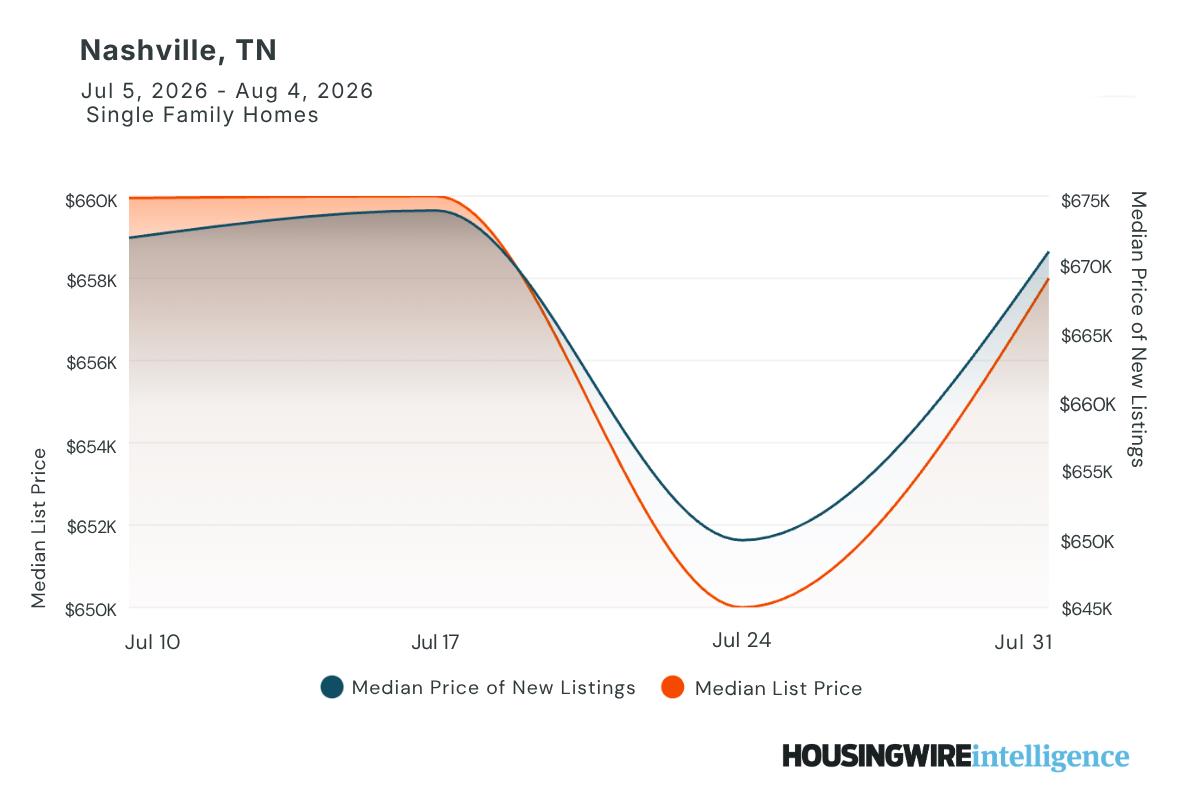
Nashville shows the divide among active, new and pending inventory
Nashville-Davidson-Murfreesboro-Franklin, Tenn., provides one of the clearest examples of the divergence between the broader active market and homes entering the market today.
The overall active median in Nashville stood at $589,945 for the week ending July 31, down 1.5% from $598,900 a year ago. The median price of newly listed homes was $549,900, up 4.7% from $525,000.
That divergence has now persisted for 10 consecutive weeks. New listings remain approximately $40,000 below the overall active median, showing that homes entering the market today are being priced differently from the broader inventory already competing for buyers.
Days on market helps explain why. Nashville’s average days on market exceeded the median by 43 days, a gap that has held near that level for three consecutive weeks. Older listings continue to linger, giving them greater influence on the overall active median even as new listings enter at lower price points.
The pending-list data adds a third signal. The median list price of homes newly moving to pending was $522,445, approximately $27,500 below the new listing median and roughly $67,500 below the overall active median.
Together, the three measures show that new listings enter below the broader active inventory but above the price level where homes are now attracting contracts.
Buffalo shows the pattern in reverse
Buffalo-Niagara Falls, N.Y., shows the same year-over-year divergence, but its current pricing relationship points in the opposite direction.
The overall active median in Buffalo stood at $267,900 for the week ending July 31, down 7.9% from $290,000 a year ago. The median price of newly listed homes was $299,900, up 11.1% from $269,900.
New listings are entering the market approximately $32,000 above the overall active median. That inversion has persisted for 10 consecutive weeks, making it more than a short-term fluctuation.
Pending-list pricing adds a third signal. The median list price of homes newly moving to pending was $289,900, up 7.9% from $268,750 a year ago. Although that measure no longer matches the new listing median exactly, both remain well above the broader active median.
The $10,000 gap between new and pending-list pricing is modest compared with the broader divide between recent market activity and the active inventory pool. Looking at all three measures shows a market where recently listed homes and homes attracting contracts are clustering near $300,000, even though the broader active inventory carries a substantially lower median.
Buffalo shows why the direction of the gap matters. An overall median decline does not necessarily mean homes entering the market today are being priced lower or that buyers are concentrating at the bottom of the active inventory range.

Milwaukee shows where new and pending-list prices align below the active market
Milwaukee-Waukesha, Wis., adds a third variation to the national pattern.
The overall active median stood at $449,000 for the week ending July 31, down 10.2% from $499,900 a year ago. The median price of newly listed homes was $399,900, up 5.2% from $380,000.
Unlike Buffalo, where new listings and pending activity sit above the overall active median, Milwaukee shows those two measures aligned below the broader active market. The median price of newly listed homes and the median list price of homes newly moving to pending were both $399,900.
The measures don’t track the same homes, but their alignment suggests new listings and homes attracting contracts are clustering around the same price. The overall active median remained approximately $49,000 higher.
That relationship has persisted throughout the 10-week period analyzed. At the same time, absorbed listings increased 27.7% year over year and months of inventory remained at 1.34, indicating that demand has remained firm even as the broader active market carries a higher median than recent listing and pending activity.
Milwaukee shows why the overall active median does not always reflect where the newest market activity is concentrated. Comparing all three signals helps housing professionals distinguish the broader inventory pool from the price range associated with homes entering the market and successfully attracting contracts.

Why it matters
The national median list price is one of the most widely cited figures in housing. By construction, it is a blended number that reflects everything currently listed for sale, regardless of when the homes entered the market or how their prices have changed.
This week’s HousingWire Data analysis found that in nearly one in four metro areas, the overall active median and new listing median were moving in opposite directions. Adding pending-list pricing completes the picture.
How are homes entering the market being priced? How does that compare with the broader active inventory? At what list-price level are homes successfully attracting contracts?
Nashville, Buffalo and Milwaukee demonstrate why those relationships matter. The same national pattern can reflect a sizable gap between new and pending-list prices, a market where recent activity is concentrated above the overall active median or one where new and pending-list prices align below it.
For agents, investors and builders, the more useful question isn’t simply whether the median is rising or falling. It’s whether the prices of new listings, active inventory and homes moving to pending are converging or drifting farther apart.
The Spotlight takeaway
The national median remains an important starting point for understanding housing market trends. Looking at new listing and pending-list pricing alongside it adds context about how those trends are unfolding within local markets.
When the measures begin telling different stories, the relationships among them become signals worth watching.
The national median is the starting point. Looking deeper helps explain what comes next.
Explore the data
Look deeper in your market with HousingWire Intelligence. Compare new listings, active inventory, pending activity and other local housing market signals at the national, metro and ZIP code levels.
For weekly analysis of mortgage rates, housing demand and the economic forces shaping the market, read Logan Mohtashami’s Housing Market Tracker.
HousingWire Data methodology: This analysis is based on HousingWire Data’s national single-family housing dataset through July 31, 2026, with year-over-year comparisons to the week ending Aug. 1, 2025. The divergence analysis reflects 298 metro areas with at least 300 active single-family listings. Metrics include active inventory, overall active median list price, median new listing price, the most recent median list price of homes moving to pending, absorbed listings, days on market and months of inventory. Pending-list prices reflect the latest asking price recorded when a listing moved to pending, not the final contract or sale price.
------------Read More
By: Rachel Bader, HW Data
Title: Housing Market Spotlight: What the national median price isn’t telling you
Sourced From: www.housingwire.com/articles/housing-market-pricing-signals/
Published Date: Wed, 05 Aug 2026 13:49:13 +0000