.png)
Inflation data was warm last week, but mortgage rates remain near their lowest levels for 2025 because mortgage spreads continue to outperform. Last week featured a hot Producer Price Index (PPI) report and a core Consumer Price Index (CPI) inflation rate of 3.1% year-over-year, and still — mortgage rates didn’t budge much.
The stability in mortgage spreads has helped maintain these lower rates even as the 10-year yield has increased. If we had the worst mortgage spreads of 2023, mortgage rates would have been 0.70%-0.80% higher even before last week. The unsung hero of housing in 2025 is mortgage spreads.
Mortgage spreads
The improvement in mortgage spreads in 2025 doesn’t seem to be getting the attention it deserves because I believe most people are unaware of it. Demand could have suffered severely if mortgage spreads hadn’t improved from the worst levels of 2023. With additional rate cuts, a dovish stance from the Fed and less market volatility, we can expect gradual improvements in the spreads over time. This was my mindset going into 2024 and it has continued into this year as well.
For 2025, I anticipated a 0.27%-0.41% improvement, starting from a 2.54% average in 2024, which had already shown improvement in 2024. While we haven’t quite reached that target level yet, we are very close now.
Last week was yet another example of why better mortgage spreads matter: When bond yields made an aggressive move higher, the spreads got better, limiting the damage to mortgage rates. In 2023 and even in 2024, mortgage rates would have not only been higher to start the week, but would have gone even higher with rising yields. The next time you see a mortgage spread, say thank you!
If the spreads were as bad as they were at the peak of 2023, mortgage rates would currently be 0.80% higher. Conversely, if the spreads returned to their normal range, mortgage rates would be 0.50%-0.70% lower than today’s level. Historically, mortgage spreads have ranged between 1.60% and 1.80%.
The best levels of normal spreads would mean mortgage rates at 5.88% % to 6.08% today, a notable difference.
10-year yield and mortgage rates
In my 2025 forecast, I anticipated the following ranges:
- Mortgage rates between 5.75% and 7.25%
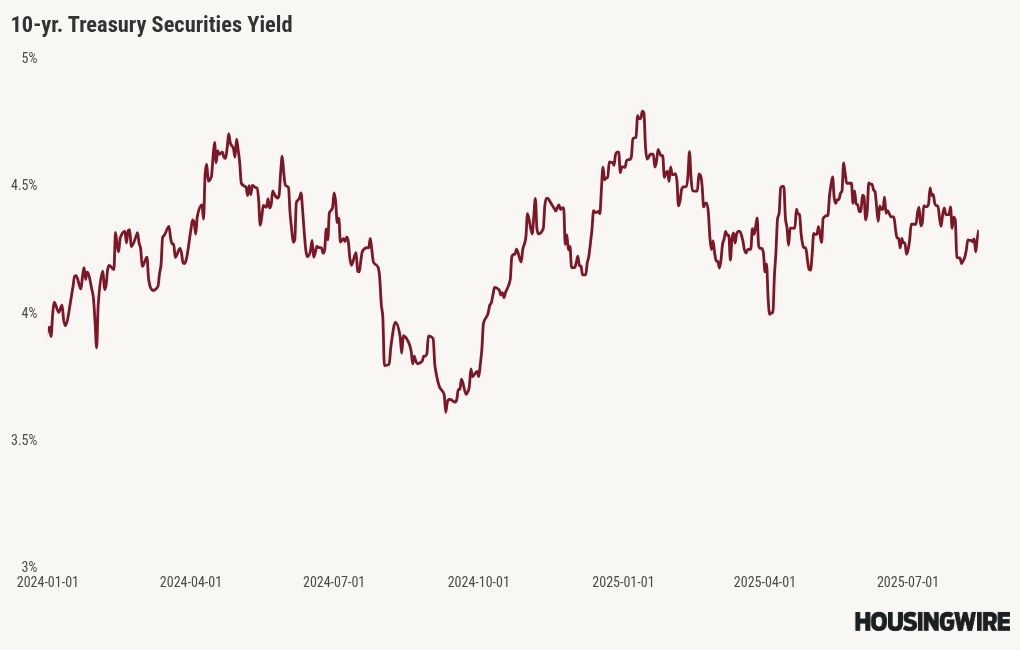
- The 10-year yield fluctuating between 3.80% and 4.70%
To keep it simple on what happened last week, the PPI inflation report was hotter than anticipated, which caused bond yields to increase, reaching 4.30% before ending the week at 4.32%. Mortgage rates started the week at 6.58%, dipped to 6.53%, and then returned to where they began at 6.58%.
It has been a long time since people have experienced a noticeable downtrend in mortgage spreads, making it unfamiliar territory for them to see how resilient mortgage rates can be at this stage of the cycle. We don’t need sub-4% on the 10-year yield to get near 6% mortgage rates anymore; just getting closer toward 4% with an improving spread can work now.
Weekly housing inventory data
I was shocked that inventory fell two weeks ago, and I was the person who noticed that he housing inventory data was stabilizing in mid to late June. However, an inventory drop in the first week of August is still rare; it was more common in the pre-COVID era. With that said, I was expecting a pick-up this week and we barely got anything.
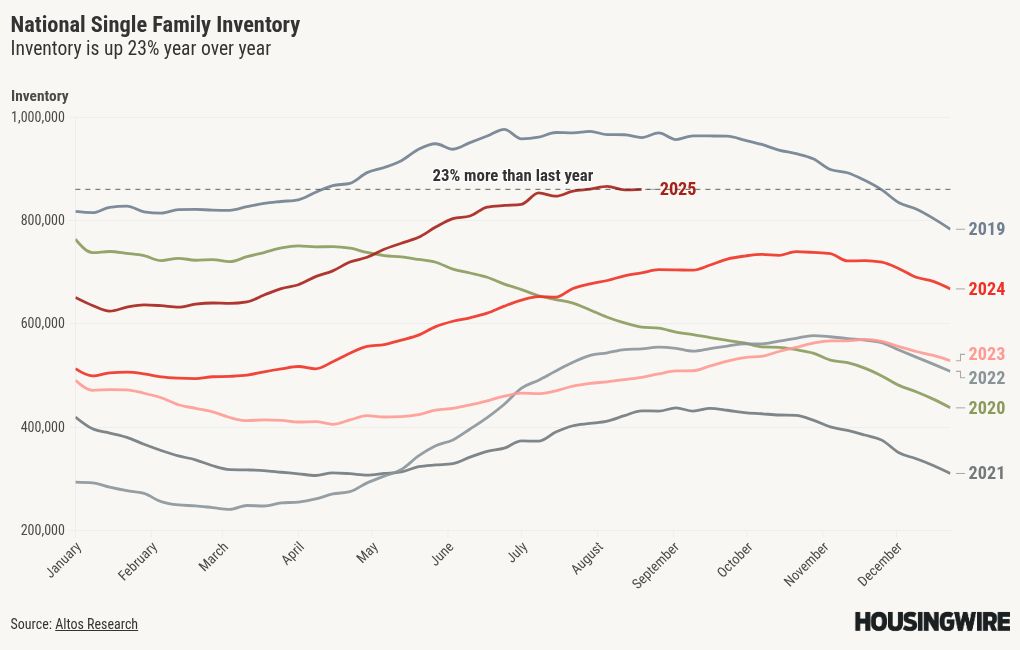
Now, the year-over-year inventory growth has gone from 33% down toward 23%, and this is happening without rates getting near 6%. No matter what happens to inventory the rest of the year — even if it has its seasonal decline earlier than what we have been accustomed to, — the growth in inventory in 2025 has been a good thing for housing.
Last week, inventory rose a minimal amount:
- Weekly inventory change (Aug. 8-Aug. 15): Inventory rose from 859,096 to 860,068
- The same week last year (Aug. 9-Aug. 16): Inventory rose from 692,833 to 698,161
New listings data
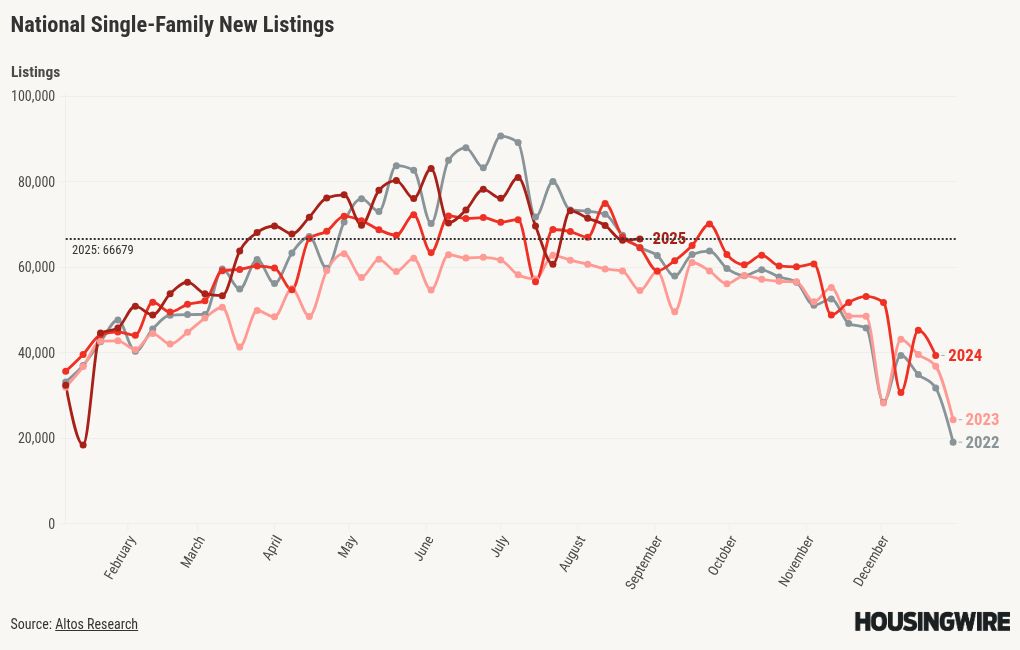
The new listings data reached its peak during the week of May 23, totaling 83,143 listings. Really since that time, it has been trending slowly lower. If I compare 2025 to 2022, we are trending below 2022 levels currently. This week, I was looking for a bounce here as well and barely got anything. Again, we are negative year over year, which is something I didn’t want to see.
To give you some perspective, during the years of the housing bubble crash, new listings were soaring between 250,000 and 400,000 per week for many years. Here’s last week’s new listings data over the past two years:
- 2025: 66,679
- 2024: 67,476
<div class=”flourish-embed flourish-chart” data-src=”visualisation/24702839?1694080″><script src=”https://public.flourish.studio/resources/embed.js”></script><noscript><img src=”https://public.flourish.studio/visualisation/24702839/thumbnail” width=”100%” alt=”chart visualization” /></noscript></div>
Price-cut percentage
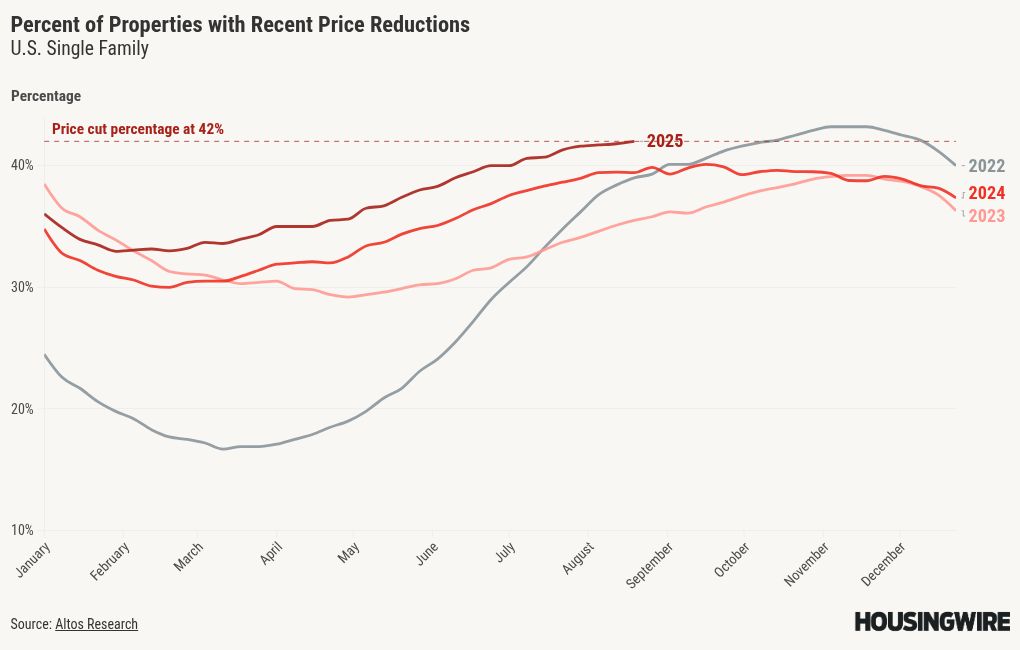
In an average year, around one-third of homes see price reductions, which is a regular part of the housing market. Homeowners often lower their sale prices when inventory levels increase and mortgage rates remain high. As a result, with more homes available and higher rates, the percentage of price reductions is greater than it was last year.
For my 2025 price forecast, I anticipated a modest increase in home prices of approximately 1.77%. This suggests that 2025 will likely see negative real home prices again. In 2024, my forecast of a 2.33% increase proved inaccurate, primarily because rates fell to around 6% and demand improved in the second half of the year. As a result, home prices increased by 4% in 2024. The rise in price reductions this year compared to last year reinforces my cautious growth forecast for 2025. This data line growth rate has also cooled down recently
Here are the percentages of homes that saw price reductions last week in the past few years:
- 2025: 42%
- 2024: 39%
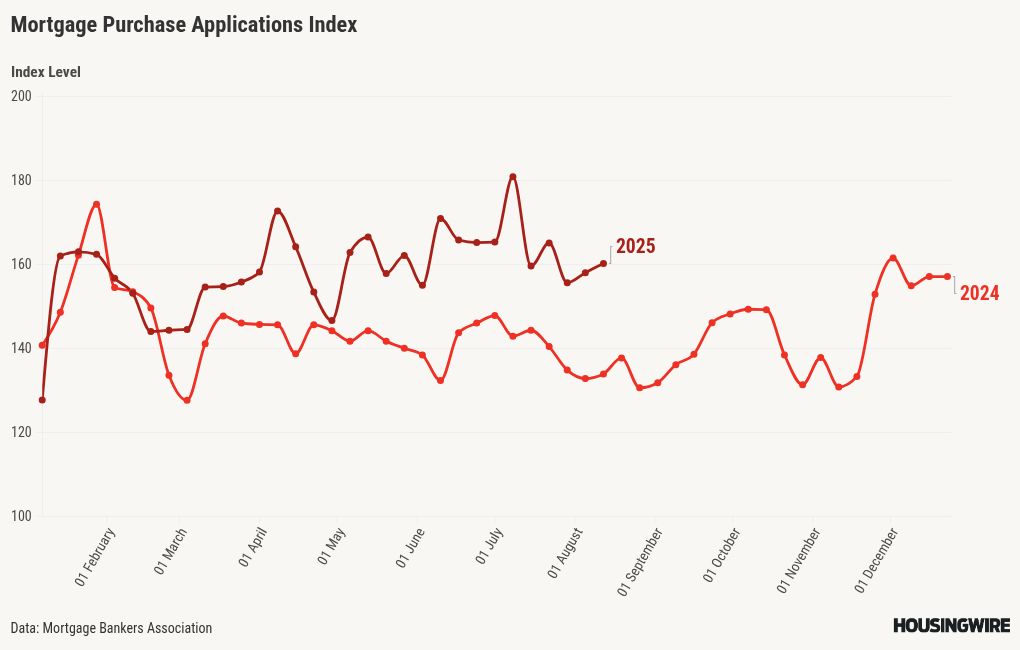
Purchase application data
Last week, the purchase application data showed a 1% week-to-week growth and a 17% year-over-year gain. The year-over-year increase in new listings can help explain the growth in the year-over-year data for purchase apps. Now that mortgage rates are below 6.64%, if they continue to fall, we should see better week-to-week data, as we have seen in the past. So far, back-to-back weeks have been positive, even though mortgage rates haven’t been much below the 6.64% level.
Here is the weekly data for 2025:
- 15 positive readings
- 11 negative readings
- 5 flat prints
- 28 straight weeks of positive year-over-year data
- 15 consecutive weeks of double-digit growth year over year
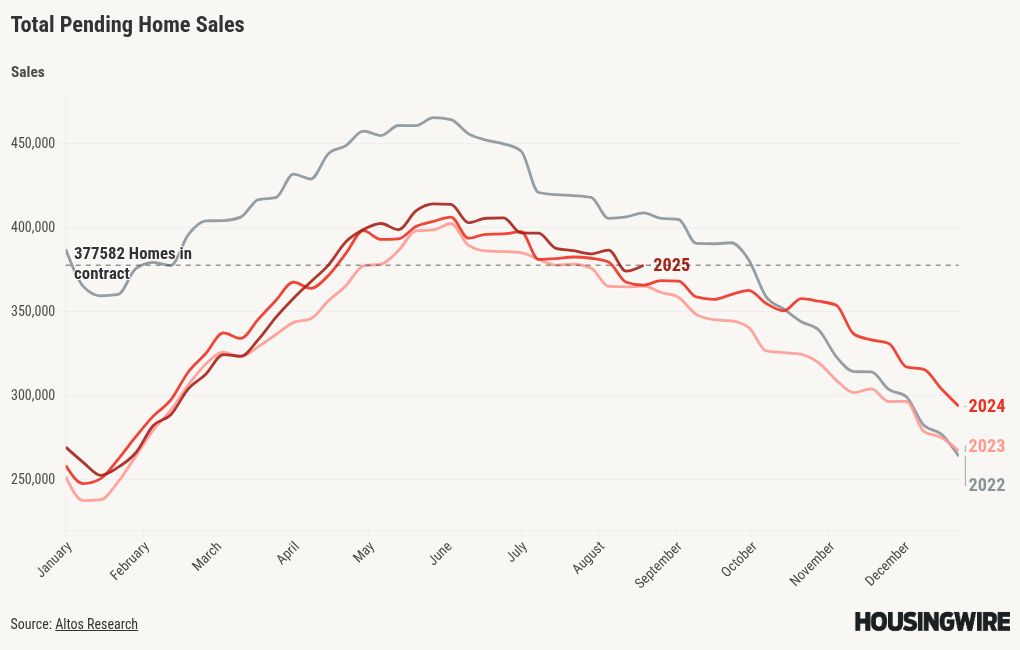
Total pending sales
The latest total pending sales data from HousingWire Data provides valuable insights into current trends in housing demand. Last year, we observed a significant shift when mortgage rates decreased from 6.64% to around 6%. Now that mortgage rates are at 6.58%, it will be interesting to see what happens with the data if we can get rates heading toward 6% with duration.
Total pending sales:
- 2025: 377,582
- 2024: 365,944
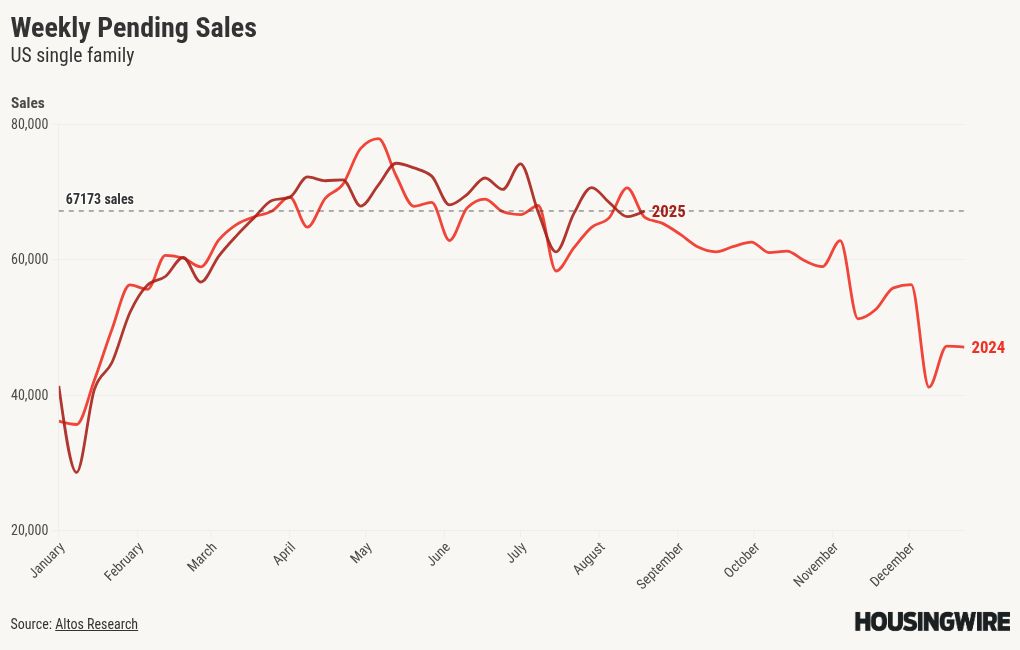
Weekly pending sales
Our weekly pending home sales provide a week-to-week glimpse into the data; however, this data line can also be impacted by holidays and any short-term shocks. Last week, we did see a slight pick up; these weekly pending contracts typically get into the sales data 30-60 days out.
Weekly pending sales for last week:
- 2025: 67,173
- 2024: 66,638
The week ahead: Jackson Hole, housing data, bond auctions and Fed speeches
Fed Chair Jerome Powell will be speaking Friday at The Kansas City Fed’s annual Economic Policy Symposium in Jackson Hole, Wyoming, making this a significant week to observe whether he expresses concerns about the recent jobs data or maintains a focus on inflation.
The week is also filled with housing data releases, including builder confidence data, housing starts and existing home sales. Recently, mortgage rates have reached a new year-to-date low, which will not yet be reflected in this week’s reports. However, we could see an increase in builder confidence data. Additionally, there will be bond auctions and comments from key Federal Reserve officials, which could influence the markets.
------------Read More
By: Logan Mohtashami
Title: Mortgage spreads cushion mortgage rates against warm inflation data
Sourced From: www.housingwire.com/articles/mortgage-spreads-cushion-mortgage-rates-against-warm-inflation-data/
Published Date: Sun, 17 Aug 2025 19:33:39 +0000
Did you miss our previous article...
https://trendinginbusiness.business/real-estate/ask-a-realtor-whats-the-most-important-thing-to-do-to-prep-my-house-for-the-market