.png)
The housing market experienced a slightly positive shift mid-June and is ending 2025 on even more positive news. Existing home sales have shown four consecutive months of year-over-year growth and our total pending home sales data has just reached a multiyear high for this calendar week.
By tracking weekly housing demand we can see that while mortgage rates spiked at the end of last year, this year we have benefited from rates remaining below 6.64% for the last 16 weeks.
Let’s take a look at the Housing Market Tracker data before the Thanksgiving holiday week, which will do a number on our data line.
Total pending home sales
Our HousingWire data tracks many categories weekly and we share just a few in these weekly tracker articles. Today, I wanted to include our total pending sales data because you can see how sales are better over the past few weeks than in the previous few years.
Over the past few years, housing data has tended to perform better when mortgage rates are below 6.64% and are heading toward 6%. As long as rates don’t spike back above 7%, we have a situation we can work with in 2026. Last year at this time rates spiked, which caused that momentum to fade. As you can see below, most of our data lines show that housing demand is very seasonal. We always keep an eye on how the market reacts to different interest rate levels to gauge what it takes to boost or lower demand.
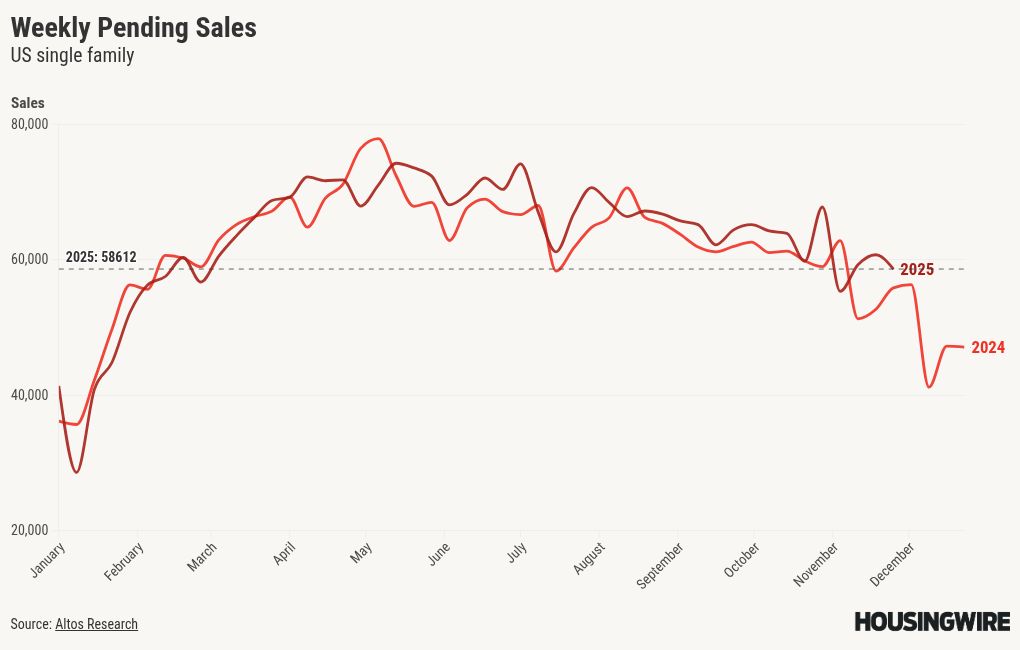
Weekly pending sales
Our weekly pending sales data indicate that these homes are going into contract and will most likely be included in the existing home sales report 30-60 days later. The two prior weeks before this week showed 15%+ year-over-year growth, even as the growth rate is slowing down. Our weekly pending sales data is different than our total pending sales, as it only accounts for the week-to-week data, which can be volatile at times.
As the Thanksgiving holiday approaches, some of our weekly data gets dramatically impacted as people tend to be busy celebrating holidays rather than selling and buying homes.
Weekly pending sales for last week:
- 2025: 58,612
- 2024: 55,862
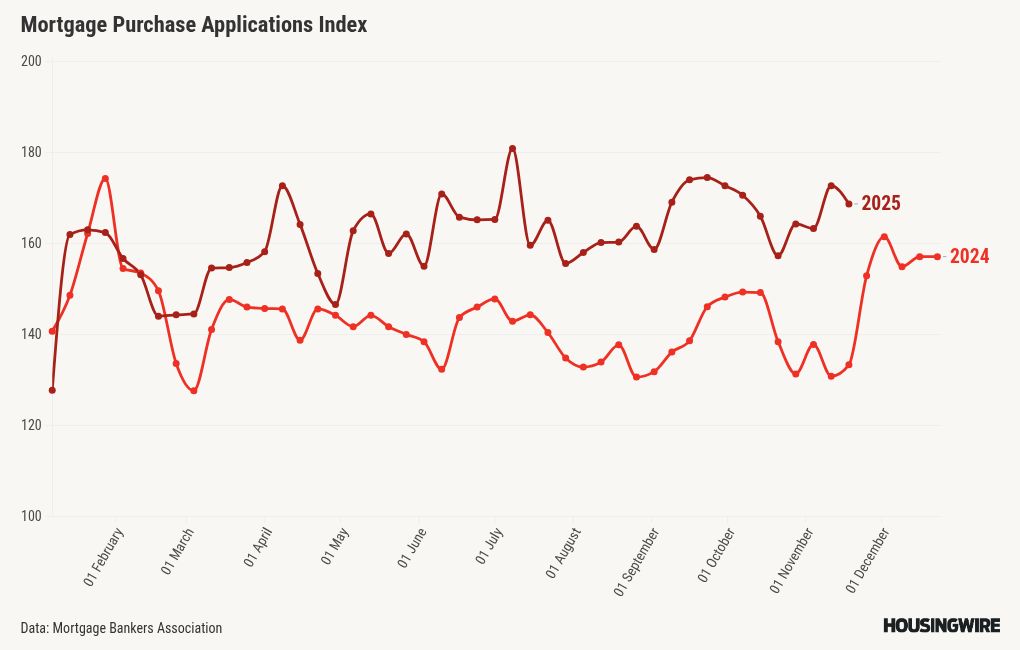
Purchase application data
We’ve had 16 weeks of testing the housing data in 2025 with mortgage rates under 6.64% and we have had nine positive week-to-week prints, seven negative prints,and 16 consecutive weeks of double-digit, year-over-year growth in purchase apps. Last week saw a 2% decrease from the previous week, but a 26% year-over-year increase.
The extreme year-over-year comps for purchase application data are over, so the bar will be much higher to replicate the 20% plus growth data going forward.
Here is the weekly data for 2025 so far:
- 21 positive readings
- 18 negative readings
- 6 flat prints
- 42 straight weeks of positive year-over-year data
- 29 consecutive weeks of double-digit growth year over year
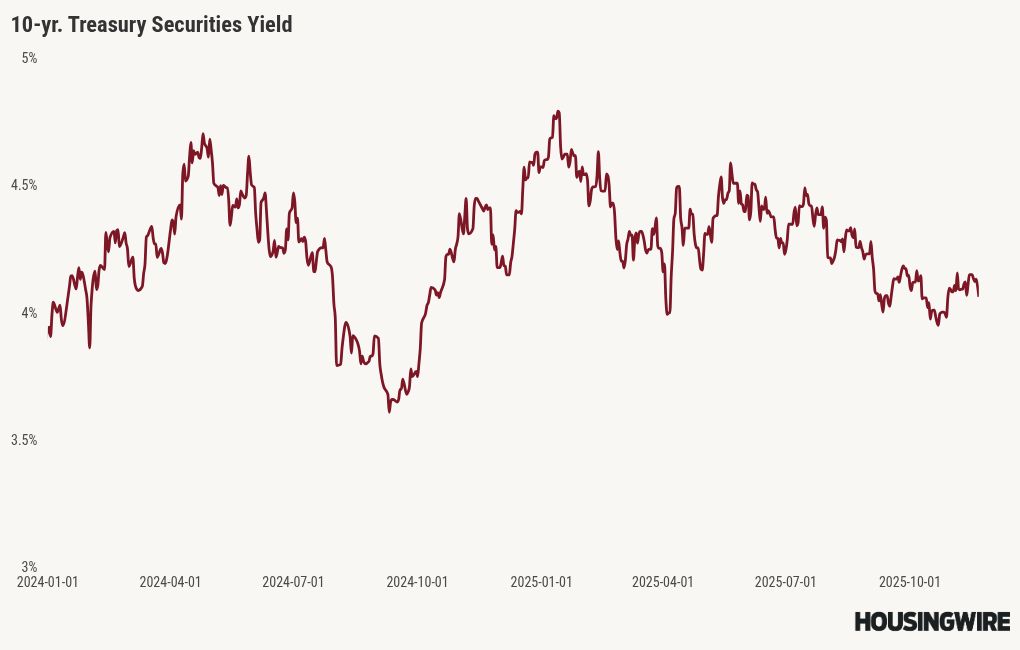
Mortgage rates and the 10-year yield
In my 2025 forecast, I anticipated the following ranges:
- Mortgage rates between 5.75% and 7.25%
- The 10-year yield fluctuating between 3.80% and 4.70%
The 10-year yield really has been in a range for about a month now, and we haven’t see too much movement in mortgage rates for some time now, even with the crazy headlines we saw last week. For the most part, the 10-year yield is hovering between 4.05%-4.15%. Mortgage rates started the week at 6.38% and ended the week at 6.34%, according to Mortgage News Daily. The loan lock data from Polly showed rates closing the week at 6.38%.
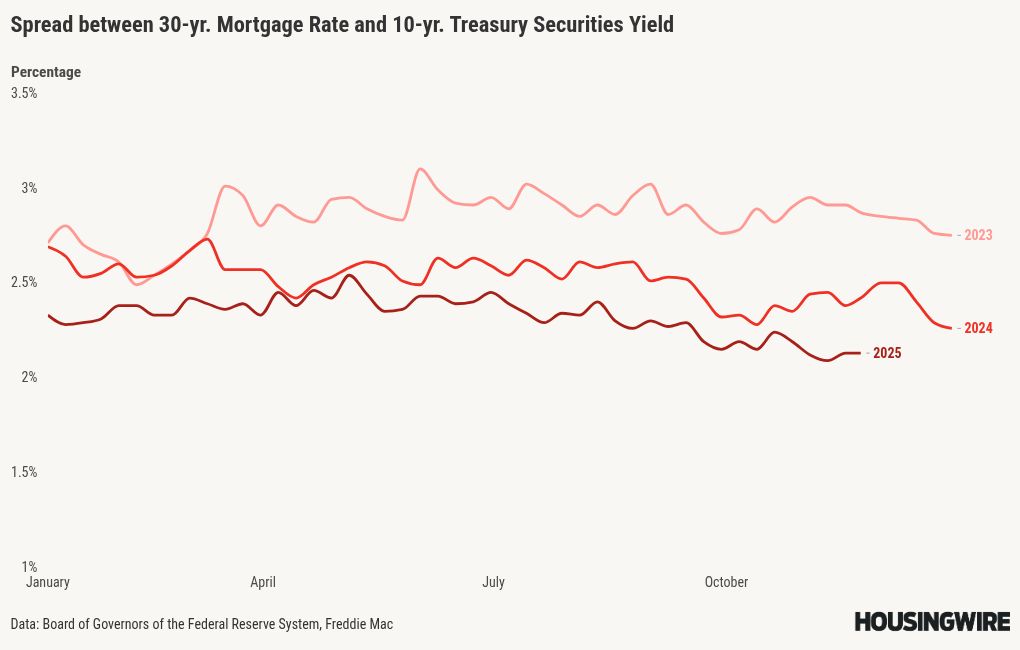
Mortgage spreads
Mortgage spreads have been the best story for mortgage rates in 2025. We are only 0.33% basis points away from normal levels again. Remember that mortgage rates would not have approached 6% if the spreads hadn’t improved this year, and we still have some room for improvement next year.
Historically, mortgage spreads have ranged between 1.60% and 1.80%. If today’s spreads were as bad as they were at the peak of 2023, mortgage rates would currently be 0.97% higher. Conversely, if the spreads returned to their normal range, mortgage rates would be 0.53% to 0.33% lower than today’s level, meaning mortgage rates would be 5.81%-6.01%.
Weekly housing inventory data
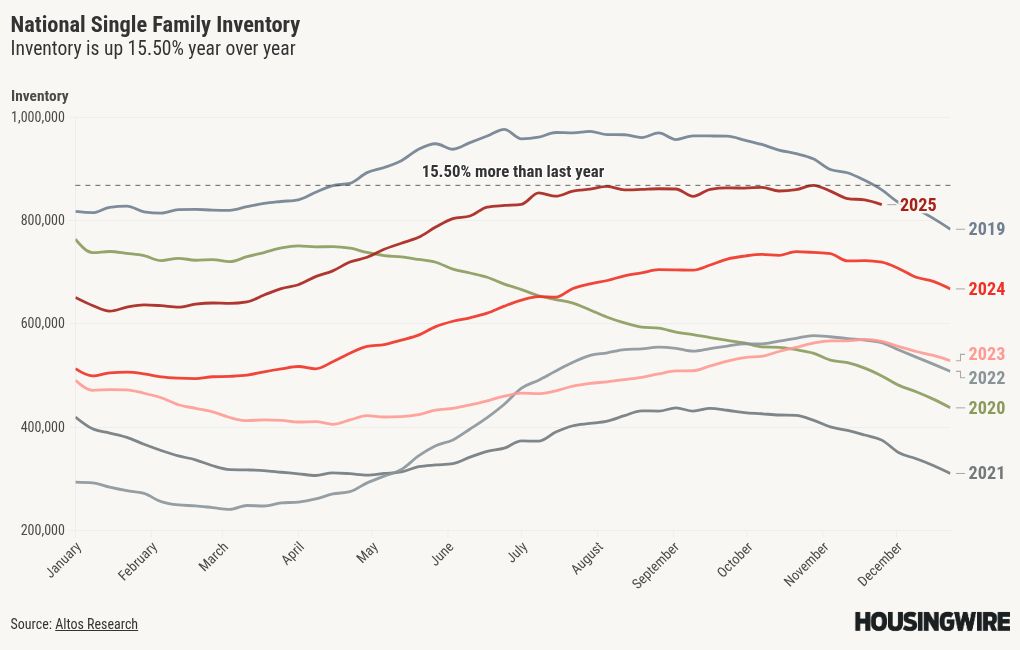
Housing inventory growth during the prime selling season increased by 33% year over year, but the growth rate has cooled off to 15.5%. As housing demand picked up slightly and new listings began to decline, the growth rate percentage of inventory has slowed by half, but remains up year over year for a healthier market.
The year-over-year growth has provided a much more buyer-friendly marketplace, but we are now in the traditional seasonal decline for 2025.
- Weekly inventory change (Nov. 14-Nov. 21): Inventory fell from 839,506 to 830,445
- Same week last year (Nov. 15-Nov. 22): Inventory fell from 721,980–719,000
New listings data
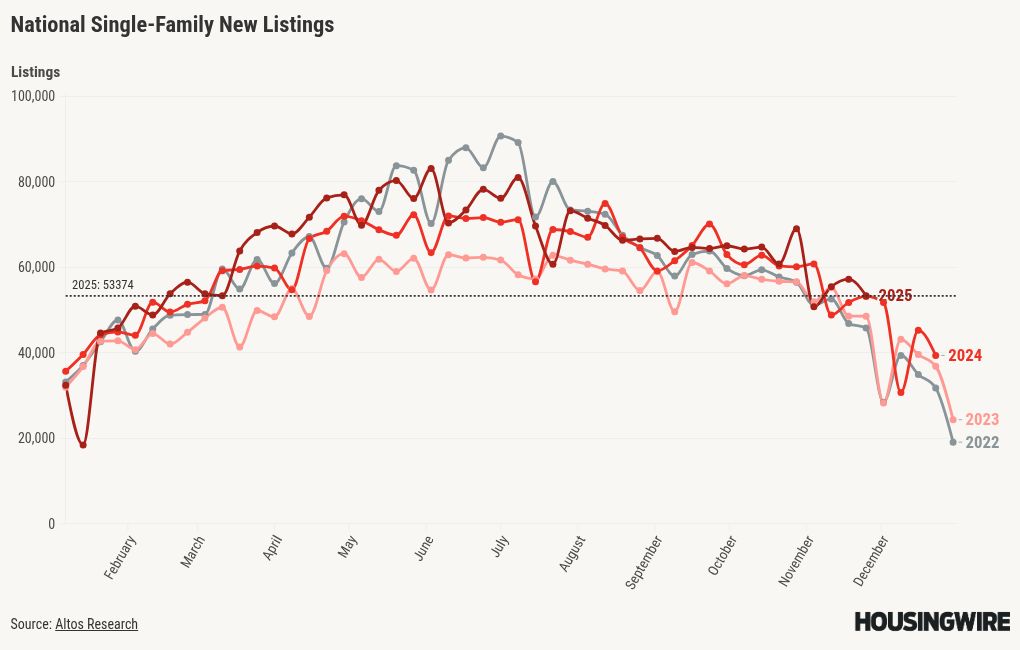
In 2025, new listings data have shown decent improvement as we strive to return to normal levels. A return to normal would mean that the seasonal increase in new listings would result in a few months with 80,000 to 100,000 new listings per week. My forecast this year predicted we would reach 80,000 new listings per week for the first time in years. We did hit that a few times but got no real growth during the seasonal peak months, and since most sellers are buyers, that was a disappointment. We are now seeing the seasonal decline in this data line.
To give you some perspective, during the years of the housing bubble crash, new listings were soaring between 250,000 and 400,000 per week for many years. Here’s last week’s new listings data over the past two years:
- 2025: 53,374
- 2024: 53,218
Price-cut percentage
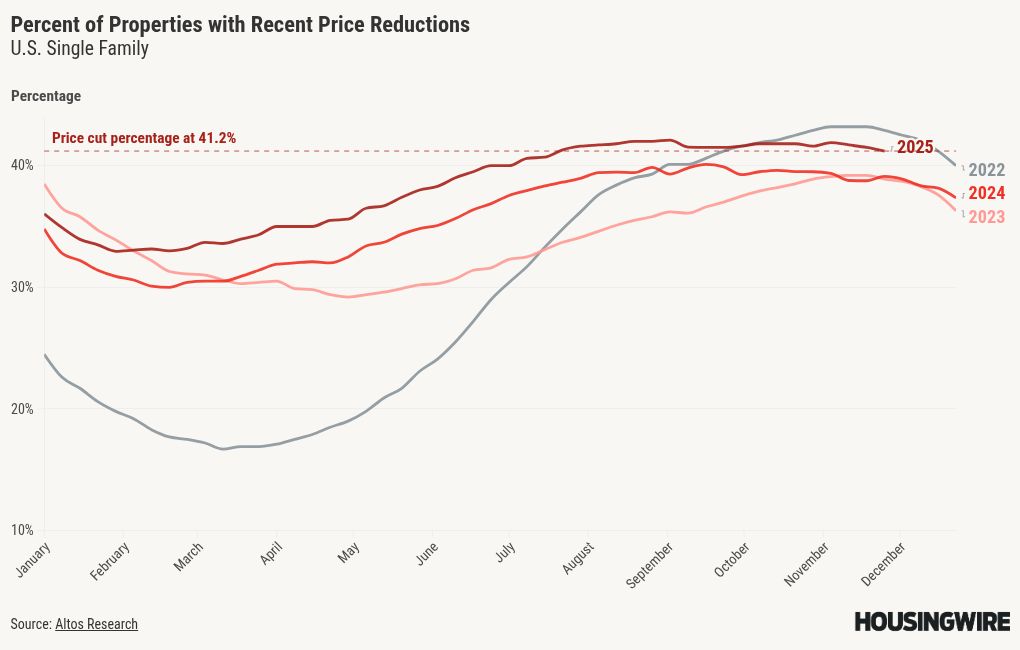
In a typical year, approximately one-third of homes experience price reductions. Homeowners adjust their sales price as inventory levels rise and mortgage rates stay elevated. With more inventory and higher rates, the price-cut percentage data is higher than last year.
For my 2025 price forecast, I anticipated a modest increase of approximately 1.77% in home prices. The rise in price reductions this year, compared with last year, reinforces my cautious growth forecast for 2025.
Here are the percentages of homes that saw price reductions in the previous week in the last two years:
- 2025: 41.2%
- 2024: 39%
The week ahead: Enjoy the short holiday week
Now that the government is operational again, we can expect several reports this week, including the older retail sales figures and durable goods orders. The ADP report now offers a weekly update, which is useful since there won’t be any BLS jobs reports until after the Federal Reserve meets in December.
This week we will also have a bond auction, speeches from Fed officials, pending home sales and home price indexes coming in. The bond and stock markets can sometimes be quite volatile during this short holiday week, so try not to overreact to this week’s market reaction. We will return to normal next week and start preparing for 2026. On Monday’s podcast, we will discuss all the positive housing developments we’ve seen in 2025 that set us up well for next year.
------------Read More
By: Logan Mohtashami
Title: Total pending home sales reach multiyear high with mortgage rates near 6%
Sourced From: www.housingwire.com/articles/pending-home-sales-2025/
Published Date: Sat, 22 Nov 2025 21:54:04 +0000