.png)
You write valuable blog content, but you still feel something’s missing. Readers skim past your thoughtful paragraphs and miss your points. That’s frustrating. You need something that stops the scroll—something that grabs attention and conveys meaning fast. You might find your secret weapon in infographics.
Blog infographics benefits are much more than aesthetics. They breathe life into your writing by combining visuals and data in a mind-friendly format. You won’t need to hire a graphic designer right away. You can start with clean layouts, icons, and easy-to-read visuals. That alone can change how people engage with your content.
Here are five quick takeaways before we dive deeper.
Quick Takeaways
- Infographics boost attention by turning paragraphs into digestible visuals.
- They simplify complex ideas through charts, timelines, and icon maps.
- They encourage sharing across social platforms and peer networks.
- They support SEO when optimized correctly with alt text and keywords.
- They aid recall and learning by pairing visual cues with text.
Why Infographics Catch the Eye
Humans are visual creatures, right? We love a good visual—and they’re super important to draw attention to your business.
Eyes Naturally Skip Walls of Text
When you scan a blog post, your eyes skip walls of text. That’s just human nature. By breaking up content with infographics, you give your readers mini-pauses—moments where visuals do the talking. It’s like offering a quick espresso in the middle of a long read. Your readers perk up, digest the idea instantly, and stay engaged.
Visuals Stand Out on Mobile
Imagery matters even more in a mobile-driven era. When someone scrolls on their phone, a high-quality infographic stands out. A bright chart or simple diagram catches attention from a crowded feed. It acts like a magnet pulling people into your blog.
Infographics Improve Comprehension
But it’s not just about looking good—infographics also improve comprehension. Complex data sets or multi-step processes get lost in a paragraph, but present that same info visually, and your reader immediately understands. A pie chart makes percentages clear.
A flowchart breaks down a process faster than five sentences ever could. Readers remember what they can see, and that boosts your content’s long-term value.
Shareability Increases Reach
Infographics also drive more shares. People are far more likely to repost an image that explains something quickly than a link that leads to five pages of analysis. That means infographics can help expand your reach and pull in new traffic from platforms like LinkedIn, Pinterest, and Instagram.
SEO Loves Visual Engagement
From an SEO angle, infographics keep users on your page longer—especially when they’re interactive. And when paired with descriptive alt text and schema markup, they can also enhance your visibility in image search. That visual content might even earn backlinks if others embed it and credit your site.
Why It All Matters
In short? Infographics don’t just “look nice.” They’re strategic. They grab attention, hold it, and leave a lasting impression, especially in a world where attention spans are shrinking by the second (thank you, TikTok!)
How Infographics Simplify Complex Topics
You know how ordering a pizza feels easier than explaining quantum mechanics? Infographics do the same thing. When you have data or processes to explain, visuals step in and make sense of it quickly.
Imagine writing about lead scoring. You could type multiple paragraphs—but readers might glaze over.
Instead, show a graphic: “Lead Behavior → Point Assignment → Sales Handoff.” That visual diagram walks them through the process in seconds. You offer clarity without fluff.
Simplified visuals don’t dumb things down. They help readers grasp the logic. They also encourage readers to bounce over from skimmers to actual readers.
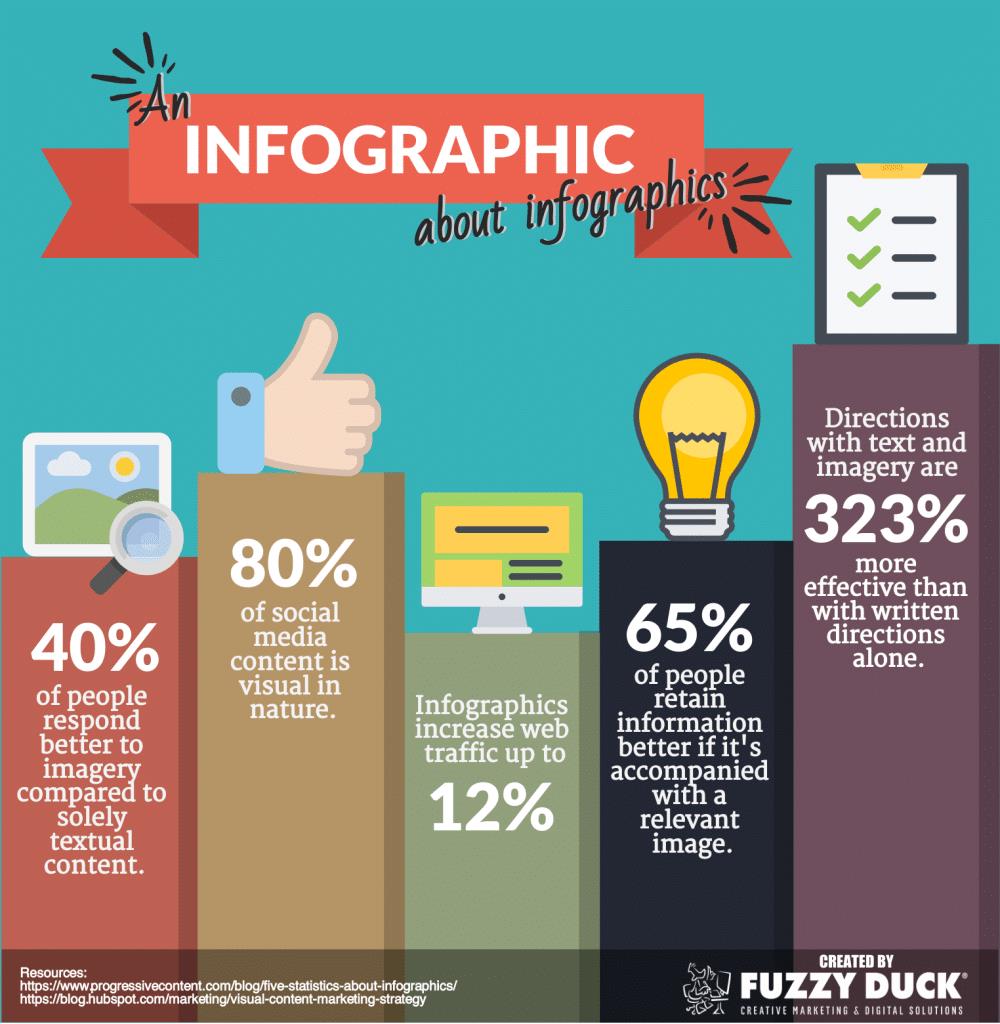
Image source
How Infographics Lift SEO and Sharing
Search engines love content that keeps readers on the page. Infographics increase time on page by making content more enjoyable. That helps your ranking over time. Plus, you can optimize your visuals with alt text and file names that include your focus keyword—like blog infographics benefits. You’ll pop up in image searches as well as general web search results.
Readers also share images more than text links. When your infographic makes a strong point, it gets reposted to social platforms, newsletters, and message boards. Each share brings traffic back to your blog—without extra advertising spend.
Infographics Build Trust and Authority
Readers trust blogs that present data clearly. When you lay out statistics visually, you signal transparency. That builds credibility. People assume your blog is smarter, more reliable. You become known for breaking data into actionable insights.
What’s a business that isn’t trustworthy? One that isn’t profitable. And you care about being profitable or you wouldn’t be here.
So, work on building “street cred.”
That’s exactly what happened with a marketing blog I follow. They added quarterly infographic updates on industry benchmarks. Rolling traffic doubled over a few months. Professionals bookmarked the post not just for the numbers—but for the way the numbers were presented.
Easy Design Tips to Make Them Work
Worried about your design skills? What if I told you that you don’t need them? Tools like Canva and Venngage come with ready-made templates. Pick a clean layout, add shapes, labels, and icons in your brand colors. Keep text concise. A few bullets or a quick statistic is enough.
Use consistent elements—fonts, colors, spacing. Stay on brand. Embed your logo discreetly. That makes your infographic look professional and polished. Use charts when showing comparisons. Use timelines for processes. Use icons for quick representation of concepts. These visuals bridge the gap between text and memory.
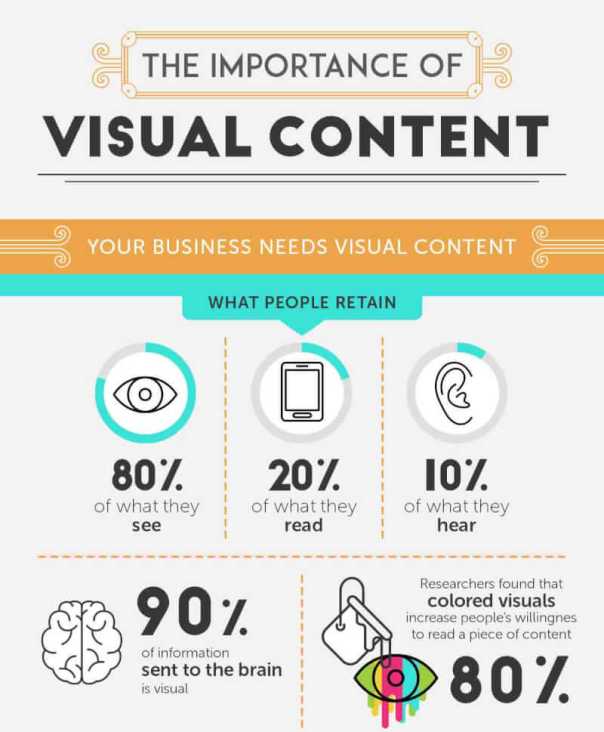
Image source
Tracking Your Infographic’s Impact
Want to know if it works? Measure. Use time-on-page data to see if people stick around longer. Check social share counts and track image source referrals. Monitor backlinks—newsletters or forums might embed your visuals, and each on-brand link is a win.
Beyond metrics, listen to feedback. Do readers mention the infographic as helpful? Did it simplify a topic they once found confusing? Those qualitative signals matter just as much.
Video source
Repurpose for Even More ROI
One infographic can serve multiple channels. Turn it into a slide deck for LinkedIn. Break it into parts for social posts. Use it in a webinar or embed it in a newsletter. At in-person events, print them as one-page leave-behinds. That’s reaching more audiences for less effort.
What to Avoid
Here’s what you don’t want to do:
- Don’t overcrowd the infographic. One idea per graphic works best.
- Avoid fine print—if text gets too small, readers skip it. Don’t forget to optimize alt text with focus keywords.
- Never publish without checking readability on both desktop and mobile.
Infographics Inside Your Blog Is WELL Worth It!
You might want your blog to pack more punch. Adding infographics helps you reach people who learn visually, search for quick facts, or hunt for sharable content. A well-designed visual can explain processes faster, keep readers on page longer, and help your content get noticed. That’s why blog infographics benefits are real results—more engagement, better SEO, and a sharper brand reputation.
When you invest a bit of time into one infographic per post, you build posts that do more than sit there: they inform, they stick, and they drive action. Add one today and feel the difference on your next analytics report.
Need help with eye-catching visuals to make your readers stay longer? Marketing Insider Group offers specialized services to help you meet your needs. We’re here to make your life easier! Contact us today to learn more or book your free consultation with our team.
Read More
By: Lauren Basiura
Title: The Benefits of Adding Infographics to Your Blog Posts
Sourced From: marketinginsidergroup.com/demand-generation/the-benefits-of-adding-infographics-to-your-blog-posts/
Published Date: Tue, 15 Jul 2025 10:00:08 +0000