.png)
SQL Server Analysis Services is a powerful tool that plays a critical role in enabling organizations to perform complex data analysis and business intelligence tasks. By leveraging the capabilities of SSAS, businesses can transform raw data into actionable insights, driving informed decision-making across the enterprise.
What is SQL Server Analysis Services?
SQL Server Analysis Services (SSAS) is a component of Microsoft SQL Server that provides tools for data analysis and business intelligence. SSAS allows organizations to build sophisticated data models that support fast, complex querying and reporting. It enables users to create multidimensional cubes or tabular models, depending on the specific needs of the business. These models are designed to handle large datasets and provide high-performance analytics, making it easier for users to explore and analyze data in a way that supports strategic decision-making.
Power BI as a Planning Tool Webinar
Watch NowWhat is a SQL Server Analysis Services OLAP Database?
A SQL Server Analysis Services OLAP database is a specific type of database within SSAS that is built to support Online Analytical Processing (OLAP). OLAP databases in SSAS are organized into multidimensional structures known as cubes, which allow for the rapid execution of complex queries across large volumes of data. These OLAP cubes are composed of dimensions and measures that enable users to perform deep, multi-faceted analysis, such as slicing and dicing data across various axes (e.g. time, geography, product lines).
An OLAP database is particularly useful in scenarios where quick access to summarized data is crucial, such as financial reporting, sales analysis, and forecasting. By storing data in a way that optimizes performance and flexibility, a SQL Server Analysis Services OLAP database empowers organizations to extract meaningful insights and make data-driven decisions efficiently.
Learn more about our Microsoft SSAS reporting solutions here.
How to Connect Power BI to SQL Server Analysis Services: Step-by-Step Tutorial & Guide
With that baseline understanding, we can connect Power BI to a SQL Server Analysis Services OLAP Database so you can easily import SSAS data for more engaging visualizations. In this tutorial, you will learn how Power BI connects to a SQL Server Analysis Services OLAP database and how to get data from there. SQL Server Analysis Services databases are one of the most common data sources for Power BI.
Step 1: Access Data from Analysis Services via Get Data
The first step is to go to Get Data >> Analysis Services:
This opens the Analysis Services connector:
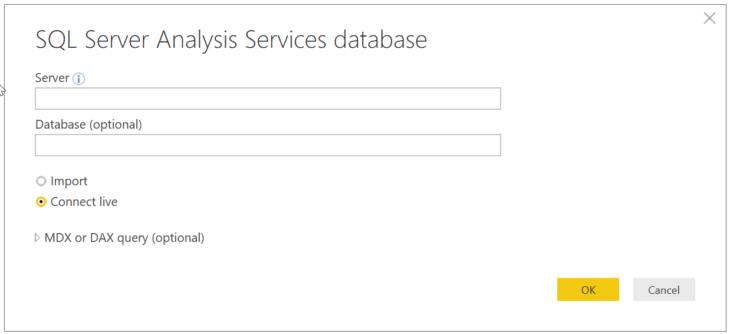
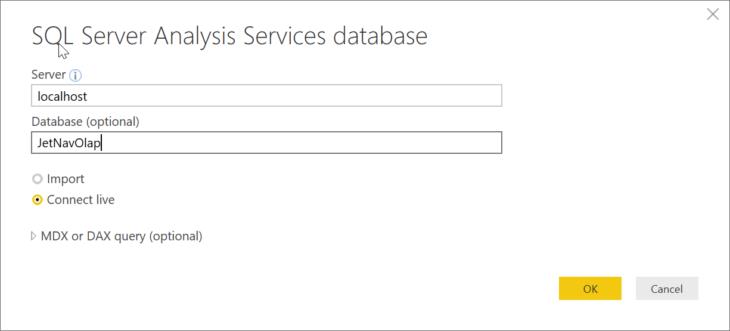
Enter the SQL Server name and the database name as required:
Step 2: Connect Live for Real-Time Data Interaction
Next, you have two options to choose from:
- Import: Loads data from the database into Power BI Desktop.
- Connect Live: Data stays in the database, and the query is executed each time you interact with visuals.
For this example, we will use the Connect Live option.
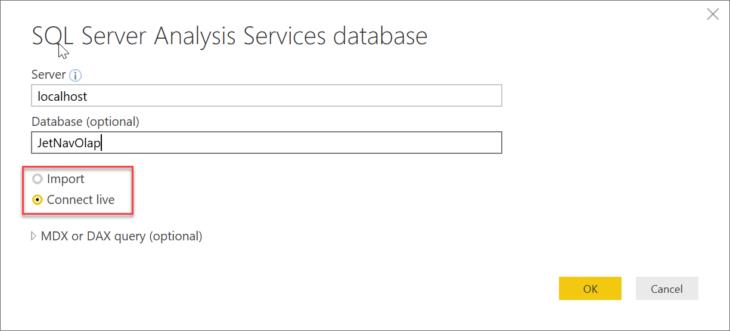
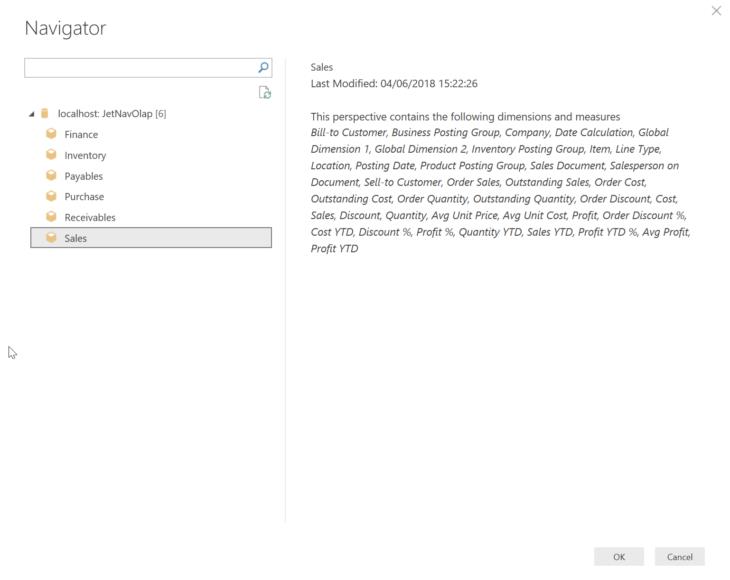
Although it is possible to write in an MDX or DAX query, this isn’t very common. Just click OK, and the connection will be established. The Navigator window will show the cubes that are in the database. If you select a cube, it will show the dimensions and measures that exist in the cube. Select the Sales cube and click OK.
Having issues starting Analysis Services? “The SQL Server Analysis Services (MSSQLSERVER) service on {computer name} started and then stopped. Some services stop automatically if they have no work to do, for example, the Performance Logs and Alerts service.” is a relatively common error. Learn how to resolve it here:
- SQL Server Analysis Services Will Not Start
Unlock Financial Insights: Power BI and Jet Reports
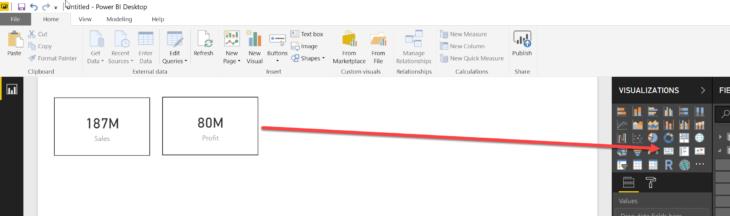
Download NowStep 3: Begin Creating Visualizations
At this point, you’re ready to start creating visualizations. Ex. Drag Sales and Profit out onto the canvas and format them to use the Card Visual:
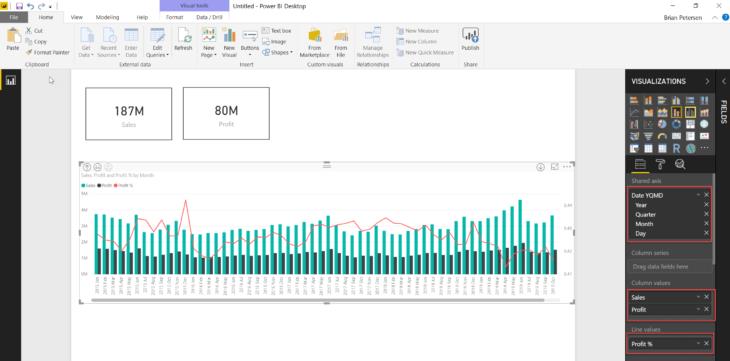
Step 4: Create a Line and Clustered Column Chart with Sales, Profit, and Profit %
Next, drag out Sales, Profit, and Profit % as a “Line and clustered column chart” across months using the date hierarchy in the Posting Date dimension. Dragging Profit % into the Line Values section will plot it on a separate axis.
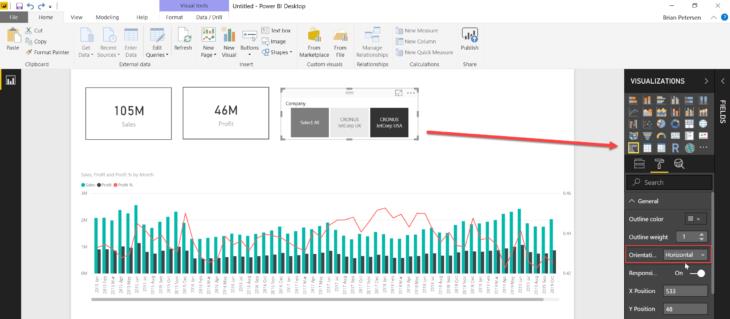
Step 5: Add a Company Slicer for Easy Data Filtering
Then drag the Company dimension out and format it as a Slicer visual with a horizontal orientation to make it easy for users to filter data by each company.
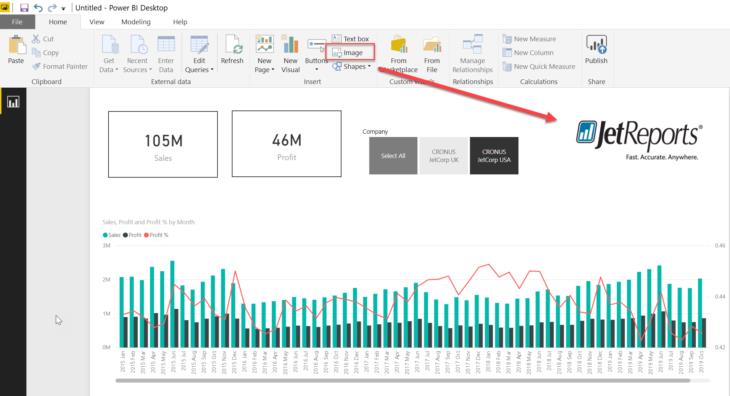
Step 6: Personalize Your Dashboard by Adding a Corporate Logo
Finally, click the Image button in the Insert section of the ribbon and select a file with your corporate logo to personalize the dashboard with your company branding.
Enhance Your Power BI Experience with Power ON and Jet Reports
We love working with Power BI and love showing partners like you how to do more with it. For example, our Power ON platform is designed to extend Power BI’s capabilities by adding writeback functionality and advanced planning and forecasting features. This allows finance teams to perform budgeting, what-if analysis, and much more from the Power BI interface. Jet Reports is also built to work within Excel and Power BI so users can easily access data from Dynamics 365 and other ERPs without deep technical knowledge. It’s simple and fast to pull live data into reports and dashboards for real-time analytics. Both Power ON and Jet Reports are user-friendly, low-code, and customizable tools for real-time and data-driven insights that native Power BI simply can’t provide. Learn more by booking a demo below:
Upgrade Data Connectivity with Simba
If you’re looking to do more than simply connect a SQL Server OLAP cube to Power BI, Simba can help. Its ODBC/JDBC drivers provide seamless integration between reporting tools like Power BI and a variety of data sources (including SSAS). Not only does Simba expand data access, but it optimizes it for smooth performance and bulletproof reliability that enhances dashboard responsiveness. Learn how to configure and connect the Simba Spark JDBC Driver with SQLLine here.
The post How to Connect Power BI to a SQL Server Analysis Services Database for Enhanced Visuals: Pull Data from SSAS Cubes to Power BI in 2026 appeared first on insightsoftware.
------------Read More
By: insightsoftware
Title: How to Connect Power BI to a SQL Server Analysis Services Database for Enhanced Visuals: Pull Data from SSAS Cubes to Power BI in 2026
Sourced From: insightsoftware.com/blog/how-to-connect-power-bi-to-sql-server-analysis-services/
Published Date: Fri, 23 Jan 2026 11:23:52 +0000