.png)
The recent numbers from FHFA‘s National Mortgage Database tell a story about the massive amount of home equity American households have — in addition to the fact that most Americans have mortgage rates at 5% or below. These are two of the most significant differences between the current housing market and the run up to the housing bubble crash.
The difference in home equity and credit quality then and now helps explain why housing inventory levels skyrocketed from 2005 to 2008 and why we haven’t been able to return to normal inventory levels from 2022 to 2025, which according to NAR data would be between 2 and 2.5 million active listings. The number of NAR total active listing is currently at 1.53 million.
Let’s take a look at how homeowners are positioned today.
Fixed rate loans
One significant aspect of the housing market leading up to 2008 was the dramatic increase in exotic loan structures, primarily adjustable-rate mortgage (ARM) products, which accounted for over 30% of loans originated at that time. In contrast, more than 90% of the loans issued in the United States after 2010 have been long-term fixed-rate products. Currently, 40% of homeowners don’t have a mortgage loan at all and of those who do, 70.4% have fixed rate loans of 5% or less.
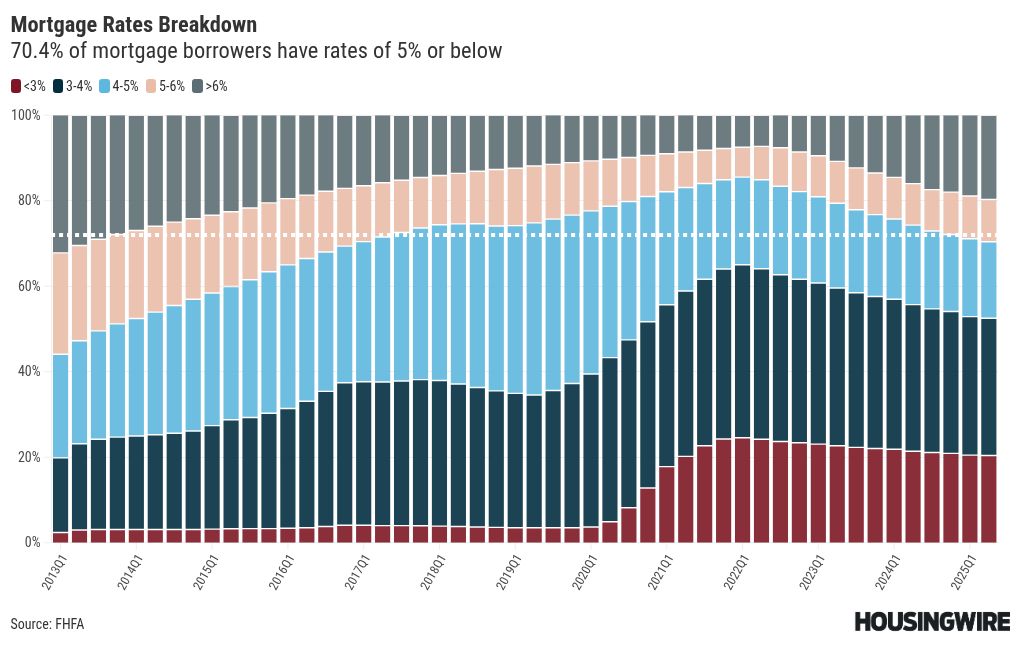
This is why many homeowners in America have excellent FICO scores; their long-term debt costs remain fixed as their wages rise.
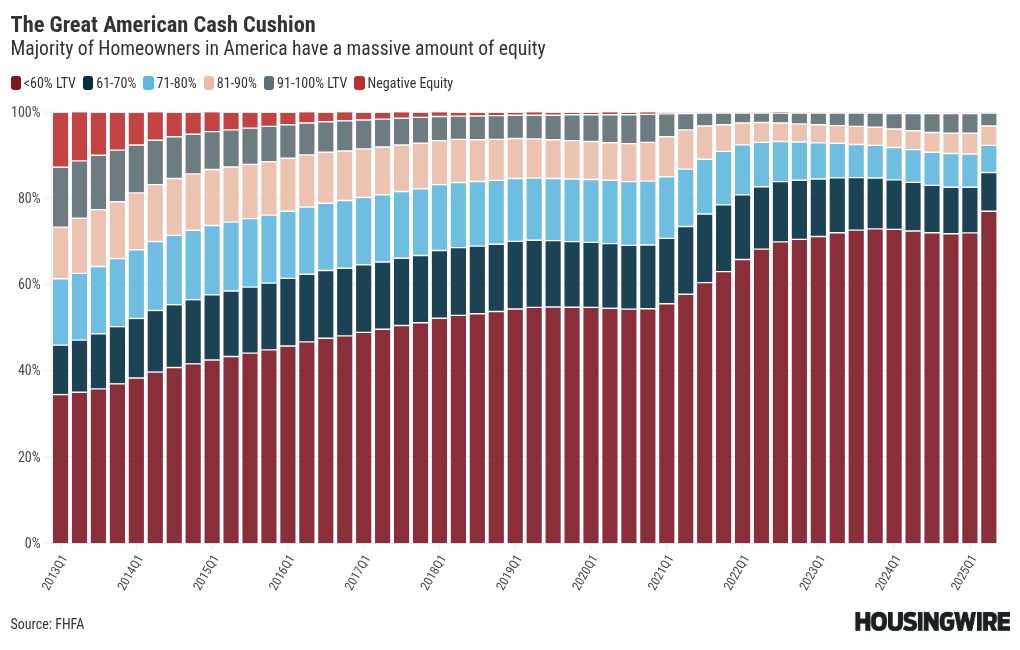
Americans have massive home equity
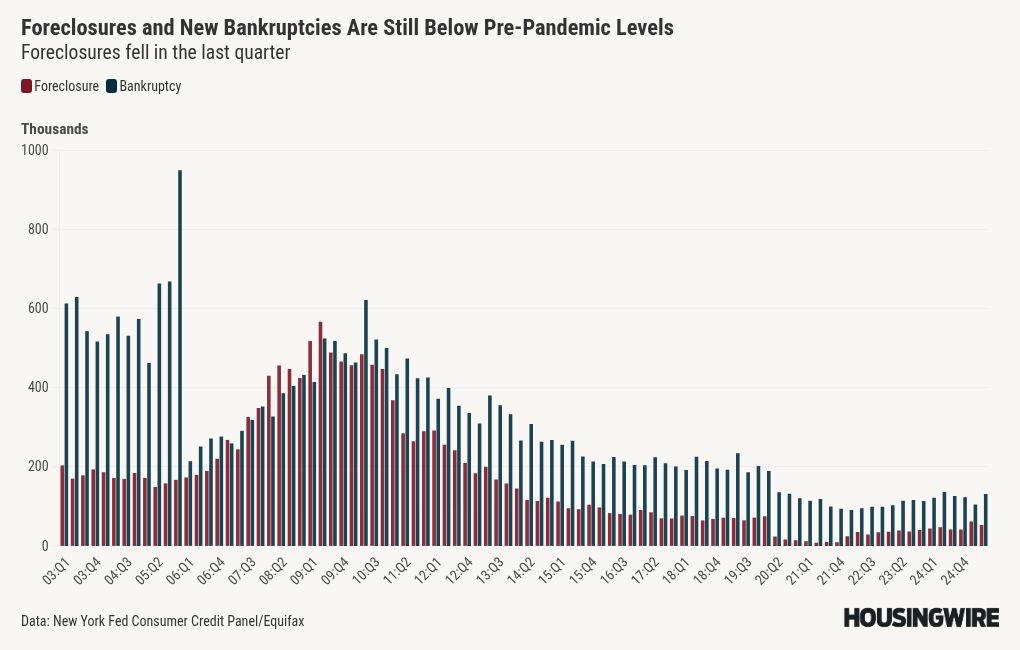
One of the hallmarks of the housing bubble crash period was the significant number of foreclosures happening in America. With so many distressed homeowners and underwater mortgages, it was the biggest bust in American economic history. Compare that to the massive amount of home equity Americans are sitting on today.
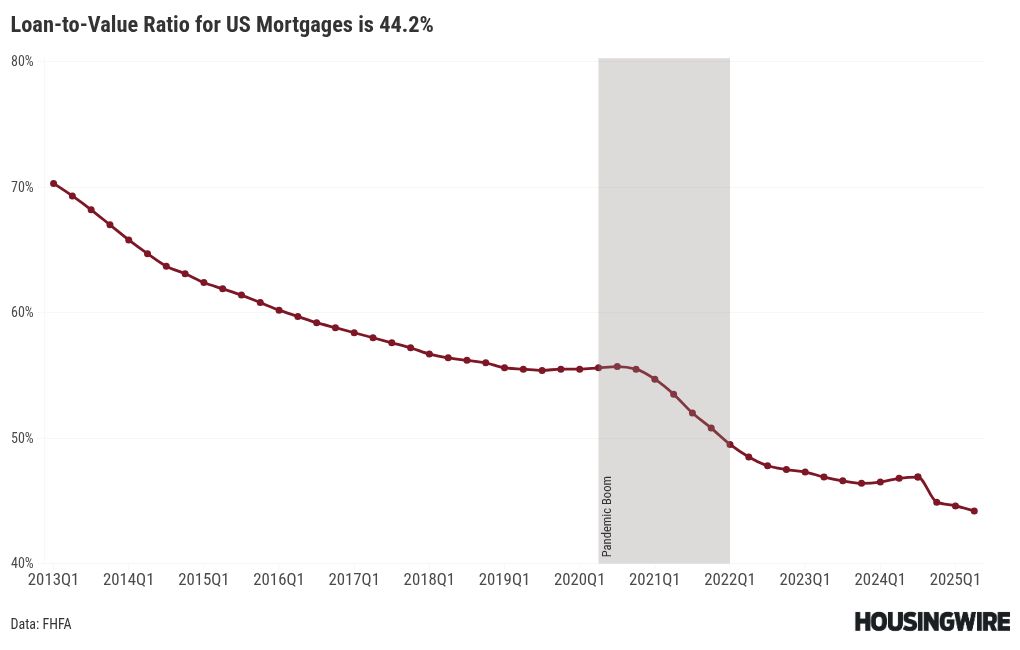
During the run-up to the housing crisis in 2008, the loan-to-value ratio reached as high as 85%. Currently the loan-to-value ratio stands at 44.2%.
Another topic that doesn’t get a lot of play is that the down payment percentage data was falling from 2001 to 2008, and in the last few years, it has been rising to 21st-century highs. Homeowners have a healthy median down payment level to start with, unlike the 21st-century lows in 2008.
Conclusion
You don’t need to be an economist to understand the data above. It’s not a repeat of the housing crisis in 2008; in fact, it’s the exact opposite. Between 2005 and 2008, foreclosure and bankruptcy rates increased, culminating in the Great Financial Recession, as illustrated in the chart below.